Fruits in syrup
Belongs to:
Canned fruits, Canned plant-based foods, Desserts, Canned foods, Plant-based foods, Plant-based foods and beverages
Contains:
Nutrition facts
Average nutrition facts for the 1531 products of the Fruits in syrup category for which nutrition facts are known (out of 1640 products).
| Nutrition facts | As sold for 100 g / 100 ml |
Standard deviation | Minimum | 10th centile | Median | 90th centile | Maximum |
|---|---|---|---|---|---|---|---|
| Energy |
308 kj (74 kcal) |
124 kj (32 kcal) |
0 kj (0 kcal) |
202 kj (48 kcal) |
274 kj (65 kcal) |
598 kj (151 kcal) |
1,950 kj (465 kcal) |
| Fat | 0.126 g | 0.195 g | 0 g | 0 g | 0 g | 0.5 g | 10 g |
| Saturated fat | 0.021 g | 0.04 g | 0 g | 0 g | 0 g | 0.1 g | 2.7 g |
| Monounsaturated fat | 0 g | 0 g | 0 g | 0 g | 0 g | 0 g | 0 g |
| Polyunsaturated fat | 0 g | 0 g | 0 g | 0 g | 0 g | 0 g | 0 g |
| Trans fat | 0 g | 0 g | 0 g | 0 g | 0 g | 0 g | 0 g |
| Cholesterol | 0 mg | 0 mg | 0 mg | 0 mg | 0 mg | 0 mg | 60 mg |
| Carbohydrates | 16.8 g | 5.98 g | 0 g | 11.5 g | 15.1 g | 33.3 g | 172 g |
| Sugars | 14.3 g | 3.14 g | 0 g | 9.3 g | 14 g | 20 g | 100 g |
| Fiber | 0.934 g | 0.488 g | 0 g | 0 g | 0.9 g | 1.7 g | 12.3 g |
| Proteins | 0.369 g | 0.275 g | 0 g | 0 g | 0.5 g | 0.79 g | 6.7 g |
| Salt | 0.014 g | 0.02 g | 0 g | 0 g | 0.01 g | 0.05 g | 20.8 g |
| Alcohol | 0.052 % vol | 0.245 % vol | 0 % vol | 0 % vol | 0 % vol | 1.2 % vol | 15 % vol |
| Vitamin A | 51.3 µg | 45.4 µg | 0 µg | 0 µg | 60 µg | 120 µg | 72,600,000 µg |
| Vitamin C (ascorbic acid) | 16 mg | 19.5 mg | 0 mg | 0.9 mg | 4.9 mg | 53.1 mg | 332 mg |
| Vitamin B9 (Folic acid) | 95.4 µg | 48.4 µg | 5 µg | 5 µg | 122 µg | 128 µg | 128 µg |
| Potassium | 82.9 mg | 27.6 mg | 0 mg | 40 mg | 79 mg | 129 mg | 75,000 mg |
| Calcium | 3.43 mg | 6.32 mg | 0 mg | 0 mg | 0 mg | 16 mg | 28,600 mg |
| Iron | 0.156 mg | 0.189 mg | 0 mg | 0 mg | 0 mg | 0.51 mg | 514 mg |
| Fruits‚ vegetables‚ nuts and rapeseed‚ walnut and olive oils | 65.4 % | 17.4 % | 0 % | 44 % | 58 % | 100 % | 100 % |
| Fruits‚ vegetables‚ nuts and rapeseed‚ walnut and olive oils (manual estimate from ingredients list) | 55 % | 6.58 % | 44.2 % | 50 % | 57 % | 73 % | 75 % |
1,632 products
-
Pfirsischhälften - Freshona - 820g
-
Резени от манго - Vitasia - 425g

-
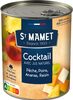
Cocktail 4 fruits Sans sucres ajoutés - St Mamet - 4x113 g
-
Ananas tranches entières pur jus - U - boîte de 10 soit 340 g
-
Mangue en tranches - CARREFOUR CLASSIC' - 425 g ( 235 g égoutté)
-
Peach Slices in Light Syrup - Everyday Essentials - 411 g

-
Lychees dénoyautés - Saint Mamet - 565 g

-
ananas 40Cal 100gr - St Mamet - 570 g
-
Ananas au sirop, en morceaux - St Mamet - 470 g
-
Stoofperen - Delicieux - 520g

-
Cocktail avec jus naturel - St Mamet - 425 g
-
Coupelles de Fruits Pêches - Ananas - Papaye rouge au sirop léger - Baccara - 4x120 g
-
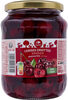
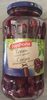
Cerises Griottes Dénoyautées - Carrefour - 680 g (égoutté : 350 g) 720 ml
-
Cocktail de Fruits - St Mamet - 425 g
-
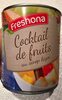
Frucht-Cocktail, leicht gezuckert - Freshona - 820g
-
Coupelles du Verger - Auchan - 0.452 kg

-
Kirschen - Harvin - 680 g (égoutté : 350 g) 720 ml
-
Cocktail de Fruits avec son jus naturel - St Mamet - 850 g

-
Coupelle de fruits à l'ananas - U - x4 soit 260 g

-
Ananas en morceaux au sirop léger - Freshona - 565 g
-
2 boîtes Cocktail 4 fruit - Baccara - 500 g (825 g)
-
Plaisir de Fruits - Pêche Poire Ananas - St Mamet - 825 g
-
Pêches 🍑avec jus naturel - St Mamet - 850 g
-
Peach Slices In Syrup - Tesco - 410g
-
Fruit cocktail in juice - Del Monte - 415g
-
Del Monte - 300g
-
Ananas origine Philippines en tranches au jus Sans sucres ajoutés - St Mamet - 570 g
-
Peach Slices in Light Syrup - Summer Pride - 411g
-
Mangues en tranches - St Mamet - 425 g
-
Poires Williams - St Mamet - 850 g
-
Coupelle meli melo Fruistar - 4 x 70 g
-
Cocktail de Fruits - St Mamet - 425 g
-
Cocktail 4 fruits au sirop - Douceur du Verger - 500 g
-
Coupelles fruits du verger à la poires, pêches et pommes - U - x4 soit 260 g

-
Salade de fruits - St Mamet - 850 g
-
MELOCOTON EN ALMIBAR - Hacendado - 600 g

-
Melocoton en almíbar - Hacendado - 480 g (850 g)
-
Peach slices in light syrup - Lidl - 410g
-
Cocktail de 4 Fruits avec jus naturel - Saint mamet - 212 g

-
Abricots au sirop - Marque Repère - 410 g

-
Ananas en tranches - Solaya - 340 g

-
Récolte du Verger (x3) - St Mamet - 212 g

-
Pêches - Carrefour - 230 g
-
Oreillons de Pêches au sirop léger - U - 230 g
-
Plaisir de Fruits - Pêche Ananas Kiwi - St Mamet - 825 g

-
Cerise Bigarreau - St Mamet - 425 g
-
Oreillons de Pêches au sirop léger - U - 465 g
-
Poires bio - St Mamet - 825 g
-
Williams Christ Birnen - FRESHONA - 820g
-
Litchis au sirop - Douceur du Verger - 250 g

-
Fruit To Go - Les fruits du Verger - St Mamet - 135 g

-
Abricots Pelés - St Mamet - 410 g

-
Peaches halves in juice - Del Monte - 235g

-
Mangue en tranches au sirop léger - Agidra

-
Litchis dénoyautés - Carrefour - 560 g
-
Poires Williams demi-fruits sirop léger - Carrefour - 412 g

-
Abricots Demi-fruits - Carrefour - 410 g

-
Coupelles de fraicheur de fruits - Auchan - 0.452 kg
-
Peach slices in grape juice - Freshona

-
Cocktail 4 fruits - Prix Mini
-
Mandarin Segments - Aldi - 300 g (drained : 175 g)

-
Abricots demi-fruits - Carrefour - 420 g
-
Abricots oreillons - Auchan - 0.82 kg
-
Mangues tranches - U
-
Poires william au sirop Douceur du verger 455g Poires william au sirop Douceur du verger - 455 g

-
Pêches demi-fruits au sirop - Douceur du Verger - 410 g
-
Poires Williams - St Mamet - 425 g

-
Pêches au sirop - - 820 g

-
Poires Williams - Carrefour - 825 g
-
Coupelles pêche et mangue sans sucre ajoutés - U - x4, 260 g
-
Oreillons d'abricots au sirop léger - U - 4/4, 475 g

-
Abricots Pelés - St Mamet - 820 g
-
Pêches avec jus naturel - St Mamet - 850 g
-
Cocktail de fruits au sirop léger - Eco+ - 825 g
-
Pêches demi-fruits au sirop - Douceur du Verger - 465 g
-
Coupelles pêche,poire et mandarine sans sucre ajoutés - U - x4, 260 g

-
Mandarinen - GUT&GÜNSTIG - 312g
-
Mangue au sirop - Douceur du Verger - 235 g
-
Demi-Pêches au sirop léger - Baccara
-
Poires williams demi-fruits au sirop - Marque Repère - 225 g
-
Cocktail 4 fruits - Paquito
-
Poires Williams - St Mamet - 425 g
-
Demi-fruits Pêches au sirop léger - Paquito - 410 g (425 ml / poids net égoutté : 230 g)

-
Ananas en tranches au sirop léger - Agidra - 340 g
-
Cocktail 4 fruits - U
-
Ananas pur jus tranches entières - U - 3 x 1/4, 408 g

-
Cocktail 4 fruits - Carrefour - 825 g

-
Abricots demi-fruits au sirop léger - Paquito - 475 g

-
Cocktail 4 fruits - Carrefour - 412 g
-
Coupe soleil sirop léger - Fruistar - 480 g
-
Peach Slices - ASDA

-
Top Budget Peche SIROP - 465 g
-
Poires Williams - St Mamet - 425 g

-
Coupelles Méli mélo de fruits à la pêche, poire et ananas - U - 4 x 65 g
-
Pêches demi-fruits - Carrefour - 840 g

-
Mélange 3 fruits - Freshona - 480 g
-
Mirabelles Au Sirop Beyer, Bocal 660ML, - 350 g - 660 ml

-
mix exotique - Carrefour - 560 g

-
Demi-fruits au sirop léger - Pêches - €CO+
-
Poires williams demi-fruits au sirop léger - Paquito - 800 g
