Beef dishes
Belongs to:
Contains:
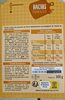
Nutrition facts
Average nutrition facts for the 2539 products of the Beef dishes category for which nutrition facts are known (out of 2688 products).
| Nutrition facts | As sold for 100 g / 100 ml |
Standard deviation | Minimum | 10th centile | Median | 90th centile | Maximum |
|---|---|---|---|---|---|---|---|
| Energy |
572 kj (137 kcal) |
197 kj (48 kcal) |
0 kj (0 kcal) |
351 kj (84 kcal) |
516 kj (123 kcal) |
968 kj (232 kcal) |
3,660 kj (874 kcal) |
| Fat | 6.17 g | 3.55 g | 0 g | 2.1 g | 5.3 g | 14 g | 45 g |
| Saturated fat | 2.34 g | 1.46 g | 0 g | 0.7 g | 2 g | 5.2 g | 23 g |
| Monounsaturated fat | 1.49 g | 0.699 g | 0.77 g | 1.17 g | 1.3 g | 3.81 g | 6.25 g |
| Polyunsaturated fat | 0.335 g | 0.104 g | 0 g | 0.21 g | 0.39 g | 0.41 g | 0.81 g |
| Trans fat | 0.086 g | 0.171 g | 0 g | 0 g | 0 g | 0.47 g | 1.32 g |
| Cholesterol | 32.9 mg | 27.5 mg | 0 mg | 4 mg | 30 mg | 83 mg | 116 mg |
| Carbohydrates | 9.01 g | 5.98 g | 0 g | 0.9 g | 9.3 g | 19 g | 72 g |
| Sugars | 1.69 g | 0.947 g | 0 g | 0.4 g | 1.6 g | 3.3 g | 27 g |
| Fiber | 1.36 g | 0.67 g | 0 g | 0 g | 1.4 g | 2.5 g | 60 g |
| Proteins | 9.23 g | 4.75 g | 0 g | 3.8 g | 7.8 g | 19 g | 47.8 g |
| Salt | 0.898 g | 0.309 g | 0 g | 0.53 g | 0.81 g | 1.57 g | 25.1 g |
| Alcohol | 0 % vol | 0 % vol | 0 % vol | 0 % vol | 0 % vol | 0 % vol | 0.5 % vol |
| Vitamin A | 20.4 µg | 27.5 µg | 0 µg | 0 µg | 23.4 µg | 90.6 µg | 441 µg |
| Vitamin C (ascorbic acid) | 0.407 mg | 0.635 mg | 0 mg | 0 mg | 0 mg | 1.8 mg | 21.2 mg |
| Vitamin B2 (Riboflavin) | 0.23 mg | 0.082 mg | 0 mg | 0 mg | 0.26 mg | 0.28 mg | 0.28 mg |
| Vitamin B9 (Folic acid) | 246 µg | 5.01 µg | 236 µg | 244 µg | 246 µg | 256 µg | 256 µg |
| Potassium | 231 mg | 96.9 mg | 10 mg | 113 mg | 217 mg | 354 mg | 354 mg |
| Calcium | 11.3 mg | 9.03 mg | 0 mg | 0 mg | 8 mg | 33 mg | 71 mg |
| Iron | 1.37 mg | 0.724 mg | 0 mg | 0.64 mg | 1.12 mg | 2.67 mg | 6.55 mg |
| Fruits‚ vegetables‚ nuts and rapeseed‚ walnut and olive oils | 21.3 % | 15.2 % | 0 % | 0 % | 21 % | 47 % | 56.5 % |
| Fruits‚ vegetables and nuts - dried | 1.18 % | 1.69 % | 0 % | 0 % | 0 % | 5.96 % | 7 % |
| Fruits‚ vegetables‚ nuts and rapeseed‚ walnut and olive oils (manual estimate from ingredients list) | 18.6 % | 9.05 % | 1.33 % | 6 % | 20 % | 34 % | 54.9 % |
2,680 products
-
Slow cooked steak with baby potatoes - pure power

-
Steak haché - purée à l'Emmental - La Cuisine d'Océane - 300 g

-
Beef Ravioli - Latina Fresh - 625g

-
Corned Beef - Exeter - 340 g

-
Corned beef - Woolworths - 340 g
-
Tripes à la mode de Caen au Calvados - Tripes Paillard - 1 kg
-
Rindfleischsuppe nach osteuropäischer Art - Kuljanka - 800g
-
Ravioli Pur Bœuf - Carrefour - 400 g

-
Shepherd's Pie - Bassili's Best - 907 g

-
Bourguignon de Bœuf Charolais -
-
Bœuf bourguignon et pommes de terre grenaille - les marmites du val de Sée - 750 g
-
Bœuf bourguignon - Cora

-
Bœuf bourguignon - Tendre & Plus

-
Boeuf bourguignon - Charcuterie du Blavet

-
LE BOEUF BOURGUIGNON - Maison Roustit - 500 g
-
Bœuf bourguignon -

-
Boeuf bourguignon -

-
Bœuf Angus bourguignon - Le Boeuf est dans le Près - 450 g

-
Bœuf Bourguignon - Lechef
-
Rundersoepballetjes - Albert Heijn - 250 g

-
Palm Corned Beef with Juices - 326g

-
Corned Beef - Golden Country - 326g

-
Mini boulettes* cuites* à base de préparation de viande de bœuf et de protéines de soja assaisonnée - Auchan - 0.75 kg
-
Le Spaghetti Bolognaise - Panzani - 400g
-
Hachis parmentier - Leaderprice - 33 g
-
Carbonnades Flamandes - Equinox - 400 g

-
Emincés de boeuf sauce poivre & pommes de terre - Fleury Michon - 280 g
-
Boeuf bourguignon - Auchan - 0.4 kg
-
BOX Bolognaise / Bolognese Festonate - Bon App' - 300 g
-
Ravioli - Maggi - 1pcs
-
Moussaka - Auchan - 0.3 kg
-
Le Cannelloni pur bœuf - Panzani - 400 g

-
Carpaccio citron vert & menthe - Bigard - 190g
-
Blanquette de Veau au vin blanc - Monique Ranou - 400 g

-
Beef Sungapore style Noodles - Co-Op
-
Spaghetti Bolognaise - Auchan - 0.4 kg

-
Gardiane de taureau - Saveurs de Cocagne - 650 g
-
Rinds Saftplätzli - Naturaplan - 257g

-
Hachis Parmentier gratiné à l'emmental - Carrefour - 1 kg
-
Veal Axoa - Pays Gourmand - 390 g

-
Pastrami de Boeuf - au Poivre - Fleury Michon - 100 g
-
Frühstücksfleisch - Traditionelle Genüsse - 340 g
-
Ravioli - St Galler - 800g
-
1898 Boeuf Bourguignon - William Saurin - 400 g
-
Ravioli pur bœuf - Carrefour - 650 g
-
Veau aux légumes et ses pâtes - Auchan - 0.3 kg
-
Corned Beef - Dulano - 200g

-
Bolino - Pâtes à la bolognaise - Maggi - 310 g (prêt à consommer), 83 g (poids net)

-
Chili con carne - Ô Bistro - 300 g

-
Hachis parmentier - Auchan - 1 kg
-
Ravioli au bœuf - D'Antelli

-
Beef Stew - Deseret Farms
-
Ravioli Bolognaise - Toque du Chef - 800 g
-
XtremBox - Radiatori Bœuf Sauce au poivre - Sodebo - 400 g
-
Blanquette de Veau et son riz - Côté Table - 285 g

-
Raviolis - U - 800 g
-
Beef Ravioli - World Kitchen - 625g

-
Beef Ravioli - Coles - 600 g
-
Gayelord - 290g

-
Ravioli pur bœuf sans colorant ni conservateur - Panzani - 400 g

-
Ravioli bœuf - Carrefour - 300 g
-
Ravioli boeuf - Carrefour - 500 g
-
Émincés de boeuf marinés à la thaïlandaise - Picard - 300 g
-
Huvudroll - IKEA - 1000 g
-
Blanquette de veau, Riz crémeux et Champignons émincés - Marie - 300 g e

-
hachis Parmentier - Carrefour - 300 g
-
blanquette de veau - Monique Ranou - 330 g

-
Mięso wołowe z makaronem i boczkiem wędzonym w sosie pomidorowym - Stoczek - 830 g
-
Moussaka Bœuf Aubergines - Marie - 300 g
-
Pavé de Boeuf Mariné aux 3 Poivres - L'Étal du Boucher - 260 g

-
Cevapcici - Culinea - 350g

-
Boeuf Bourguignon et Ses Pommes de Terre - Marque Repère - 300 g
-
Beef Stew - Vietti - Net WT. 24 OZ., 1 LB. 8 OZ., 680 Grams
-
Ravioli Boeuf & Petits Oignons - Toque du Chef - 300 g
-
Rinder-Carpaccio - Rewe - 120 g

-
Lasagnes pur bœuf - Côté Table - 350 g

-
Fusilli au boulettes de boeuf,sauce tomate - Zapetti

-
Ravioli - Panzani - 800 g

-
Blanquette de veau - Mmm ! - 0.4 kg
-
Le Parmentier de Boeuf Charolais purée à la crème fraîche - Fleury Michon - 300 g
-
Chili con carne - Carrefour - 820 g
-
Tesco corned beef - 10, 275g
-
Hachis parmentier bio - Dietbon - 300 g

-
Couscous poulet merguez 300g - Auchan - 0.3 kg

-
Boeuf bourguignon et ses pommes de terre - Auchan - 0.3 kg
-
Paupiette de veau tagliolinis et légumes - Delhaize
-
Shepherd's Pie - By Chef Ramsay - 10 oz
-
Hachis Parmentier - Toque du Chef - 300 g e
-
corned beef

-
Beef ravioli - Heinz

-
Pams

-
Ravioli pur boeuf - Fiorini - 400g
-
Corned beef - White bell - 340 g

-
Langue de bœuf - Tendre & Plus

-
Hachis parmentier - Côté Table - 1 kg
-
Premium Beef Luncheon meat - Liberty - 340g
-
Le Ravioli Bolognaise sans conservateur - Panzani - 400 g
-
Auchan raviolis au bœuf sauce tomate et basilic - 0.3 kg
-
ravioli pur bœuf - Bio village Leclerc - 700 g
-
YUKA TEST lapin moutarde 2 - Non Indiquee