Canned tomatoes - Page 2
Belongs to:
Tomatoes, Tomatoes and their products, Canned vegetables, Vegetables, Canned plant-based foods, Vegetables based foods, Canned foods, Fruits and vegetables based foods, Plant-based foods, Plant-based foods and beverages
Contains:
Nutrition facts
Average nutrition facts for the 1214 products of the Canned tomatoes category for which nutrition facts are known (out of 1294 products).
| Nutrition facts | As sold for 100 g / 100 ml |
Standard deviation | Minimum | 10th centile | Median | 90th centile | Maximum |
|---|---|---|---|---|---|---|---|
| Energy |
106 kj (26 kcal) |
31 kj (8 kcal) |
0 kj (0 kcal) |
79 kj (19 kcal) |
96 kj (23 kcal) |
172 kj (44 kcal) |
2,080 kj (901 kcal) |
| Fat | 0.284 g | 0.25 g | 0 g | 0 g | 0.2 g | 0.5 g | 35 g |
| Saturated fat | 0.042 g | 0.06 g | 0 g | 0 g | 0 g | 0.2 g | 9 g |
| Monounsaturated fat | 0.01 g | 0.022 g | 0 g | 0 g | 0 g | 0.069 g | 1 g |
| Polyunsaturated fat | 0.036 g | 0.069 g | 0 g | 0 g | 0 g | 1 g | 1 g |
| Trans fat | 0 g | 0 g | 0 g | 0 g | 0 g | 0 g | 0.1 g |
| Cholesterol | 0 mg | 0 mg | 0 mg | 0 mg | 0 mg | 0 mg | 0 mg |
| Carbohydrates | 3.95 g | 0.951 g | 0.7 g | 3 g | 3.7 g | 5.9 g | 50 g |
| Sugars | 3.33 g | 0.682 g | 0 g | 2.44 g | 3.1 g | 4.8 g | 45 g |
| Added sugars | 0 g | 0 g | 0 g | 0 g | 0 g | 0 g | 1.63 g |
| Fiber | 1.24 g | 0.474 g | 0 g | 0.8 g | 1.1 g | 2.3 g | 11 g |
| Proteins | 1.18 g | 0.221 g | 0 g | 0.8 g | 1.2 g | 1.6 g | 89 g |
| Salt | 0.211 g | 0.223 g | 0 g | 0.01 g | 0.1 g | 0.62 g | 19 g |
| Alcohol | 0 % vol | 0 % vol | 0 % vol | 0 % vol | 0 % vol | 0 % vol | 0 % vol |
| Vitamin A | 71.1 µg | 55.4 µg | 0 µg | 0 µg | 95.1 µg | 173 µg | 2,000,000 µg |
| Vitamin D | 0 µg | 0 µg | 0 µg | 0 µg | 0 µg | 0 µg | 0 µg |
| Vitamin C (ascorbic acid) | 8.25 mg | 3.44 mg | 1 mg | 1.8 mg | 9 mg | 16.2 mg | 30.6 mg |
| Potassium | 215 mg | 48.2 mg | 0.28 mg | 168 mg | 200 mg | 314 mg | 560 mg |
| Calcium | 12.7 mg | 9.53 mg | 0 mg | 0 mg | 15 mg | 32 mg | 100 mg |
| Iron | 0.461 mg | 0.387 mg | 0 mg | 0 mg | 0.55 mg | 1.2 mg | 2.2 mg |
| Fruits‚ vegetables‚ nuts and rapeseed‚ walnut and olive oils | 77.8 % | 37 % | 0 % | 0 % | 99 % | 100 % | 100 % |
| Fruits‚ vegetables‚ nuts and rapeseed‚ walnut and olive oils (manual estimate from ingredients list) | 83.7 % | 14.8 % | 60 % | 60 % | 84.5 % | 99.4 % | 100 % |
1,292 products
-
Smashed tomatoes - Apis - 400 g
-
Pulpe de tomates concassées - Auchan - 0.4 kg
-
Tomate pelado entero - hacendado - 400g escurrido 240g
-
Valfrutta chopped tomatoes - 400g
-
Tomates concassées au basilic - FLEURS DES CHAMPS - 400 g
-
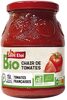
Tomates pelées entières au jus - Jardin bio - 800 g
-
Tomaten, stückig - REWE Bio - 400g
-
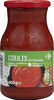
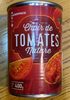
Coulis de tomates de Provence - Carrefour - 400 g 420 ml
-
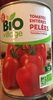
Tomates entières pelées bio - Bio Village - 400 g
-
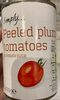
Peeled plum tomatoes - Simply... - 400 g
-
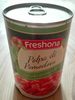
pomidory bez skóry krojone - Freshona - 400g
-
Passata Classica - De Cecco - 700 g
-
Sauce tomate Arrabiata - Jardin BIO étic - 200 g
-
Sauce tomate cuisinée - Jardin BIO étic - 510 g
-
Sauce tomate provençale aux fines herbes - Jardin bio - 250 g
-
Geschälte Tomaten - Freshona - 400 g
-
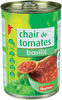
Chair de tomate - Louis Martin - 400g

-
Tomates entières pelées au jus - Eco+ - 400g

-
Passata - La Molisana - 690 g

-
Chair de tomate Nature - Notre Jardin - 400 g

-
Pelati - Longobardi - 400g
-
Pomodoro San Marzano Dell'Agro Sarnese-Nocerino D.O.P., 400 g - Mutti - 400g

-
Tomates entières pelées au jus - U - 765 g
-
Chopped tomatoes pack 4 - Waitrose - 4 x 400 g
-
Tomaten in Dose - Alnatura - 400g

-
Peeled plum tomatoes -
-
Tomaten in Stücken mit Tomatensaft - Edeka Bio - 400g
-
Double concentré de tomates - Izdihar - 400 g
-
Chair de tomates - Agidra
-
Cirio - Tomatoes - Tuscan Chopped - 400G
-
Tomate troceado - Dia - 390 g

-
Savers Chopped Tomatoes in Tomato Juice - Morrisons - 400gm
-
Tomates pelées concassées - Gotxoki - 390 g

-
Polpa datterini - Mutti - 300g

-
Tomaten stückig - Alnatura - 400 g
-
Tomaten - Passiert - Oro di Parma - 400g
-
Tomaten gehackt, natur - Gut Bio - 1pcs

-
Chopped Tomatoes in a Rich Tomato Juice - Cucina - 440g

-
Tomaten fein gehackt - Ja - 400g

-
Tomates pelées bio - Boni Selection

-
Italian Cherry Tomatoes - Tesco
-
Tomates pelees - Mutti
-
Tomates entières pelées - 4 STELLE - 380 g

-
Tomaten - Stückig mit Kräutern - Oro di Parma - 400 g

-
Tomaten Gehackt in Tomatensaft - Cucina Nobile - 400g

-
Tomaten - Stückig mit Basilikum - Oro di Parma - 400 g
-
Tomates Concassées - Carrefour - 780 g

-
Bio gehackte organic Tomaten - Freshona - 400g
-
Chair de tomate bio 400g - Saint eloi - 400 g
-
Chair de tomates nature - LEADER PRICE - 400 g
-
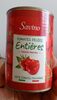
Tomates pelées entières - Savino - 240g égoutté
-
Gehackte Tomaten Basilikum - Kaufland - 400g
-
tomates entières pelées - le cabanon en provence - 765g
-
San Marzano Peeled Tomatoes - Cento - 28 oz
-
chopped tomatoes suma
-
Peeled plum tomatoes - Cirio - 4 x 400 g
-
polpa a pezzetti - Delizie del sole Eurospin - 2
-
Il polposissimo - Petti - 400 g

-
Asda Chopped Tomatoes
-
Tomaten -gehackte 400g - Gartenkrone
-
Pulpe Tomate Des Victoria Bte 1 / 2 - 400 g
-
Geschälte Tomaten gehackt in Tomatensaft - San Fabio - 400g

-
Tomates Entières Pelées au Jus - null - 0.39 kg
-
Tomaten gehackt - K-Classic - 400g
-
Chair de tomates préparée - Auchan - 0.4 kg
-
Sauce aux tomates fraîches - Auchan - 0.19 kg

-
Double concentré de tomates (28%) - Victoria - 70 g
-
Tomaten, stückig - Cidacos - 400g
-
Chair de tomates basilic - Auchan - 0.4 kg
-
Tomates entières pelées au jus - tomates pelées d'Aucy - 238g

-
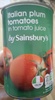
Italian plum tomatoes - Sainsbury's - 400 g
-
Polpa - Pulpe de tomates en dés - Cirio - 400 g

-
Double concentré de tomates - Fiorini - 210 g (3 x 70 g)

-
Bio Tomaten gehackt - Kräuter - Freshona - 400g
-
Sauce Tomate Basilic - Jardin bio - 250 g

-
Tomates pelées - Mutti - 800g

-
Double concentré de tomates - €CO+ - 440 g

-
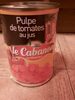
Pulpe de tomate - le cabanon en Provence - 400g
-
58cl tomates entières pelées de plein champ sans sel ajoute bio - D'aucy - 310 g
-
Italian diced tomato’s - Annalisa - 400 g
-
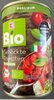
Tomaten stückig - Bio - dennree - 400 g
-
Double concentré de tomates - Carrefour - 440 g

-
Tomates Concassées - Carrefour - 390 g
-
Tomate pelado troceado - Freshona - 390 g
-
Tomatenfruchtfleisch in Stücken - Pomito - 500 g

-
Chair de tomate au basilic - Louis Martin
-
Tomaten gehackt - K-Bio - 400g
-
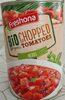
Bio chopped tomatoes - Freshona - 400g
-
Tomates entières pelées - Carrefour Bio - 400 g
-
Chair de tomates au basilic - Saint Eloi - 400 g
-
Double concentré de tomates 28% - Victoria - 70 g

-
Italian Organic Chopped Tomatoes - sainsbury's SO organic - 400 g

-
Pulpe de tomates basilic et origan - Carrefour - 3pcs
-
Peeled plum Tomatoes - 400 g
-
Tomaten gehackt - K-CLASSIC - 400g
-
Chopped tomatoes in tomato sauce - Morrisons - 4 x 400 g
-
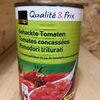
Tomaten gehackt - Coop - 400g
-
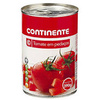
Tomate em pedaços - Continente - 390g
-
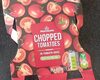
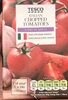
Chopped tomatoes - Tesco
-
Ganze Tomaten Geschält - Alnatura - 240g