Culinary plants - Page 34
Nutrition facts
Average nutrition facts for the 2663 products of the Culinary plants category for which nutrition facts are known (out of 5806 products).
| Nutrition facts | As sold for 100 g / 100 ml |
Standard deviation | Minimum | 10th centile | Median | 90th centile | Maximum |
|---|---|---|---|---|---|---|---|
| Energy |
503 kj (120 kcal) |
500 kj (120 kcal) |
0 kj (0 kcal) |
0 kj (0 kcal) |
317 kj (76 kcal) |
1,480 kj (357 kcal) |
5,490 kj (1310 kcal) |
| Fat | 4.17 g | 7.66 g | 0 g | 0 g | 0.5 g | 24 g | 91.6 g |
| Saturated fat | 0.738 g | 1.59 g | 0 g | 0 g | 0.1 g | 3.7 g | 50 g |
| Monounsaturated fat | 2.78 g | 4.58 g | 0 g | 0 g | 0.2 g | 14.3 g | 32 g |
| Polyunsaturated fat | 0.874 g | 1.26 g | 0 g | 0 g | 0.1 g | 3.5 g | 6.3 g |
| Trans fat | 0 g | 0 g | 0 g | 0 g | 0 g | 0 g | 0.1 g |
| Cholesterol | 0.246 mg | 1.36 mg | 0 mg | 0 mg | 0 mg | 0 mg | 67 mg |
| Carbohydrates | 15.2 g | 15.9 g | 0 g | 0 g | 8 g | 47 g | 400 g |
| Sugars | 5.87 g | 8.43 g | 0 g | 0 g | 2.3 g | 27.7 g | 100 g |
| Fiber | 2.89 g | 3.2 g | 0 g | 0 g | 2 g | 9.09 g | 63 g |
| Proteins | 2.86 g | 3.14 g | 0 g | 0 g | 1.6 g | 9.7 g | 100 g |
| Salt | 0.789 g | 1.08 g | 0 g | 0 g | 0.28 g | 2.99 g | 98.3 g |
| Alcohol | 0 % vol | 0 % vol | 0 % vol | 0 % vol | 0 % vol | 0 % vol | 0 % vol |
| Vitamin A | 28 µg | 85.3 µg | 0 µg | 0 µg | 0 µg | 300 µg | 5,000 µg |
| Vitamin C (ascorbic acid) | 3.6 mg | 7.1 mg | 0 mg | 0 mg | 0 mg | 25 mg | 133 mg |
| Potassium | 690 mg | 912 mg | 0 mg | 0 mg | 400 mg | 2,000 mg | 124,000 mg |
| Calcium | 85.4 mg | 330 mg | 0 mg | 0 mg | 0 mg | 182 mg | 4,000 mg |
| Iron | 1.58 mg | 4.64 mg | 0 mg | 0 mg | 0 mg | 16.4 mg | 2,400 mg |
| Fruits‚ vegetables‚ nuts and rapeseed‚ walnut and olive oils | 34 % | 43.9 % | 0 % | 0 % | 0 % | 100 % | 100 % |
| Fruits‚ vegetables‚ nuts and rapeseed‚ walnut and olive oils (manual estimate from ingredients list) | 64 % | 10.1 % | 40 % | 50 % | 65 % | 84 % | 100 % |
5,799 products
-
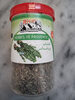
Herbes de Provence - River - 40g
-
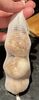
Garlic - Sainsburys - 4
-
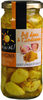
Ail Doux à L'indienne - Ail! Ail! Ail! - 230 g
-
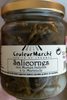
Salicornes des Marais Salants à la Marinade - Couleur Marché - 210 ml / 190 g / 80 g
-
Origan feuilles - Haya4you - 110 g
-
Petersilie glatt - Metro Chef - 40 g

-
Basilic - 20 g

-
Knoblauch mit kräutern - Piacelli - 190gr lordi, 120gr netti

-
Bio Zwiebeln - GutBio - 500 g
-
Sahne Meerrettich mild - Spreewald Feldmann - 140g
-
Ciboule (Phaak Boa Sot) - Tang - 1 sachet

-
Coriandre - Fuchs - 40 g

-
Provencale yrttiseos - Meira - 8 g

-
Sainsbury's Marjoram - 10 g
-
Orégano - Consum
-
Oregano - Tropical Sun - 30g

-
Palestinian thyme mix - Damascus for food

-
Tomilho limão - Cantinho das Aromáticas - 20 g
-
Laurel - mari paz
-
Thyme - Asda - 17g

-
Garlic chopped - Asda - 54g
-
Apio - carrefour bio - 400 g

-
basilikum - aruna - 30g

-
Cipolla di Medicina - Naturitalia - 1 kg

-
Ail blanc - U

-
Dried parsley - Asda - 11g
-
Oignons jaunes - U - 1 kg

-
Cebolinho - Cantinho das Aromáticas - 20 g
-
Thymian gerebelt - Ostmann - 15 g
-
Basilikum - Kräuter Gut - 1 Topf
-
Rewe Rosmarin geschnitten - Rewe Beste Wahl - 40 g

-
Schnittlauch - Ostmann - 5 g
-
PULPE D'AIL

-
Oregano - Asda - 25g
-
Oregano Leaves - Woolworths - 10 g

-
Persillade persil-ail-échalote - Rustica - 95 g

-
Ail aux herbes de provence

-
Frischer Knoblauch, weiss - Kaufland - 2

-
Mélange Persil/Ail coupé surgelé prêt à l'emploi (même code barre que 26030890) - All Seasons - 250 g

-
allioli - chovi - 200ml

-
Oignons rouges - Migros - 500 g
-
Scandinavische kruiden vis - Euroma - 28gr
-
Ciboulette - - 10 g

-
Erba cipollina - Budget - 12.5g

-
Qualité & Prix Chive - Coop - 10 g
-
Coriandre - Delhaize

-
Ekologisk stjälkselleri - ICA - 300 g

-
Ground Coriander - Crab Brand - 50 g
-
Black Garlic Cloves - The Garlic Farm - 50 g

-
Cebollas "Romay" - 500g

-
Confit d'oignons au speculos - La Maison Belge - 150 g
-
Speisezwiebeln - WRK - 2kg
-
Herbes de Provence - Delhaize - 15g
-
Ail en granules - Delhaize - 50 g

-
Cebolla frita crujiente - Fresquia - 100 g

-
Herbes de provence - Saveurs et epices - 100 grammes

-
Herbe de provence - 50 g

-
Oignon rouge - La ferme d'Erquinvillers - 3

-
Great Value Granulated Garlic, 26 oz

-
Celery Sticks - Pacific - 40 oz
-
Ciboulette surgelée - Saint eloi - 50 g

-
Organic Celery Sticks - Dandy Organic - 2.5 lbs
-
Oignon rouge - Carrefour

-
Perejil - Alimerka

-
Oignon Jaune
-
Ail semoule - Sainte Lucie - 49 g

-
Bay Leaves - Suma - 10 g

-
Czosnek

-
Bio Staudensellerie Klasse II - Rewe Bio - 450 g
-
Dill Bio - Rewe - 50g
-
Bio Menthe - Coop
-
Basilic - Magda - 250
-
Bio Basilic - Coop

-
Tafel Meerrettich - Kim - 140g
-
AIL SEMOULE - 160 g
-
Perejil frasco 5 g - Ducros

-
Frische Kräuter Thymian - Metro Chef - 40g
-
Oregano - Santa Maria - 65 g
-
ciboulette - Les Crudettes - 11 g
-
Dill - Delhaize

-
Zwiebeln - REWE Bio - 500 g

-
Gelbe Zwiebeln - Marktliebe - 2 kg

-
Suomalainen basilika ruukussa - Pirkka - 35 g
-
Kräutermischung - Fruteg - 190g
-
Verstegen bieslook
-
Ail noir - Santé Nat
-
Speisezwiebeln, rot - Kartoffel Deyerling Dollbergen - 1 kg
-
Weiss Knoblauch - Selection - 220 G

-
Origan
-
Knoblauch gehackt - Bresc Prodega - 450g

-
Erdperlen rote Speisezwiebeln - Edeka - 500 g

-
Feuilles De Laurier Bio - Jardin biologique - 25 g

-
Knoflookpoeder - Verstegen
-
Sauge Bio - Léa Nature - 30 g
-
Gemüse Meerrettich - Lutz

-
Ail des ours Feuilles coupées - Jardin bio - 6 g
-
Fried shallot - Dragon And Phoenix - 100 g

-
Pastilles des Alpes aux 2 menthes - L'Atelier des Lacs - 35 g

-
Thyme - Suma - 30 g

-
Ail - Denner