Dehydrated soups
Belongs to:
Dried meals, Soups, Dried products to be rehydrated, Dried products, Meals
Contains:
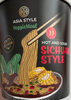
- Dehydrated Asian-style soup with noodles
- Dehydrated asparagus soup
- Dehydrated carrot soups
- Dehydrated cereals and vegetables soup
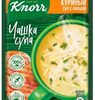
- Dehydrated chicken and vermicelli soup
- Dehydrated green vegetables soups
- Dehydrated leek and potato soup
- Dehydrated minestrone soup
- Dehydrated mixed vegetables soup
- Dehydrated Moroccan soup
- Dehydrated mushroom soup
- Dehydrated onion soup
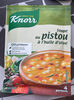
- Dehydrated pistou soup
- Dehydrated pumpkin soups
- Dehydrated soup with chicken and vegetables
- Dehydrated tomato and vermicelli soup
- Dehydrated tomato soup
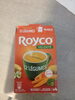
- Dehydrated vegetable soups
- Dehydrated watercress soup
- Reconstituted crustacean soup
Nutrition facts
Average nutrition facts for the 1095 products of the Dehydrated soups category for which nutrition facts are known (out of 1245 products).
| Nutrition facts | As sold for 100 g / 100 ml |
Standard deviation | Minimum | 10th centile | Median | 90th centile | Maximum |
|---|---|---|---|---|---|---|---|
| Energy |
641 kj (150 kcal) |
607 kj (143 kcal) |
1.39 kj (0 kcal) |
91 kj (22 kcal) |
247 kj (57 kcal) |
1,610 kj (383 kcal) |
2,170 kj (519 kcal) |
| Fat | 3.19 g | 3.87 g | 0 g | 0.2 g | 1.8 g | 12 g | 33 g |
| Saturated fat | 1.18 g | 1.71 g | 0 g | 0 g | 0.5 g | 5.3 g | 18 g |
| Monounsaturated fat | 3.73 g | 2.45 g | 0.68 g | 0.94 g | 4.2 g | 8 g | 9.38 g |
| Polyunsaturated fat | 0.96 g | 0.627 g | 0 g | 0.26 g | 1.1 g | 2 g | 2 g |
| Trans fat | 0.006 g | 0.021 g | 0 g | 0 g | 0 g | 0.08 g | 0.9 g |
| Cholesterol | 1.22 mg | 2.63 mg | 0 mg | 0 mg | 0 mg | 8 mg | 62 mg |
| Carbohydrates | 24.3 g | 24.1 g | 0 g | 3.7 g | 8.3 g | 64 g | 87.5 g |
| Sugars | 3.6 g | 4.43 g | 0 g | 0.4 g | 1.6 g | 14 g | 55 g |
| Fiber | 1.94 g | 2.44 g | 0 g | 0.1 g | 0.6 g | 7.7 g | 27 g |
| Proteins | 4.22 g | 4.28 g | 0 g | 0.565 g | 1.5 g | 12.2 g | 58 g |
| Salt | 3.29 g | 3.85 g | 0 g | 0.61 g | 0.95 g | 11.5 g | 6,700 g |
| Alcohol | 0 % vol | 0 % vol | 0 % vol | 0 % vol | 0 % vol | 0 % vol | 2 % vol |
| Vitamin A | 233 µg | 328 µg | 0 µg | 0 µg | 105 µg | 1,500 µg | 2,820 µg |
| Vitamin C (ascorbic acid) | 6.51 mg | 15.1 mg | 0 mg | 0 mg | 0 mg | 60 mg | 280 mg |
| Vitamin B1 (Thiamin) | 97,400 mg | 107,000 mg | 0.106 mg | 0.16 mg | 61,000 mg | 244,000 mg | 244,000 mg |
| Vitamin B2 (Riboflavin) | 0.612 mg | 0.611 mg | 0.051 mg | 0.069 mg | 0.646 mg | 2.58 mg | 2.58 mg |
| Vitamin B3/PP (Niacin) | 8.36 mg | 5 mg | 1.09 mg | 1.09 mg | 12.8 mg | 12.8 mg | 12.8 mg |
| Vitamin B9 (Folic acid) | 166 µg | 154 µg | 20 µg | 31.3 µg | 168 µg | 672 µg | 672 µg |
| Calcium | 20.8 mg | 27.7 mg | 0 mg | 0 mg | 20 mg | 118 mg | 809 mg |
| Iron | 3.67 mg | 2.98 mg | 0 mg | 0 mg | 3.6 mg | 5.76 mg | 32,000 mg |
| Fruits‚ vegetables‚ nuts and rapeseed‚ walnut and olive oils | 20.1 % | 16.5 % | 0 % | 0 % | 15.9 % | 50 % | 79.4 % |
1,244 products
-
Kremowa zupa z kurek ze szczypiorkiem - Knorr
-
Velouté instantané aux légumes cuisinés et fromage - Comme j’aime

-
Golden Vegetable Cup Soup - Newgate - 64g
-
sweet corn soup - inchi - 15 g

-
おしるこ - Morinaga - 72 g

-
Písmenková polévka - Natur compagnie - 50 g

-
17 g

-
Crema de Espárragos - Kris - 75 g

-
Tomato instant cup soup, paradicsomleves - Le gusto

-
Die gute Suppenwürze - Brenz - 540g

-
Spinatsuppe Kremet - Toro - 79 g
-
Basis voor romige lente-uisoep - Honig - 102 gr
-
Soup For A Cup Creamy Mushroom - Maggi
-
Sopa de champiñón - Campbell’s

-
Barszcz czerwony z majerankiem - Vifon - 67 g
-
Грибной крем-суп по-французски - Knorr

-
Gorący Kubek Gulaszowa z makaronem - Knorr

-
Seafood congee - Haifusheng
-
Tomatsuppe Pulver - Toro - 1.170KG
-
Sopa de Cebola - Pingo Dove - 51 g
-
Tomaten-crème soep - Honig
-
Sopa deshidratada thai - Molé - 85 g

-
Chinese kippensoep - Honig
-
Vifon

-
Tomatensoep - Cup a Soup
-
Chinese Tomatensoep - Cup a soup
-
Harira -

-
Sopa - - 200g

-
Minute soup

-
Kartoffelcreme-Suppe, mit Sahne verfeinert (Bio) - Bempflinger Lebensmittel GmbH - 390 g
-
Zupa z nudlami o smaku Kimchi - Vifon
-
Fusilli alla Carbonara - Sauce au fromage et bacon - di Canossa - 70g (250g après préparation)
-
Organic instant noodles Tom Yum - Perfect Earth - 85g
-
Maggi
-
Frühlings-Suppe (Bio) - Natuco Natur Compagnie - 40 g
-
Tom Yum Flavour Hot Pot Seasoning
-
Natureland Vegetable Broth 1 kg - Natureland General Trading Co. W.L.L.
-
Soupe HARIRA MAROCAINE lentisses, pous, épices - Maggi - 90 g
-
Sopa de vegetales con municiones - Knorr - 78 g
-
nongshim noodle chicken flavour

-
jfihdtixtuz
-
Banzaï Noudle - Banzaï Noodle - 67g

-
VeggieMeal hot and sour SICHUAN STYLE - Asia Style - 85 g
-
VeggieMeal hot and sour CHINESE STYLE - Asia Style - 110 g

-
soupe au pistou à l’huile d’olive - knorr - 1000 ml 80g
-
Куриный суп с лапшой - Knorr
-
royco velouté 12 légumes - 49.6 g
-
Goong - 65 g
-
Koninginnensoep - Cup a Soup - 3 x 18 g = 54 g
-
Champignon crème - Cup a Soup

-
Groente - Cup a Soup

-
Rundvlees - Cup a Soup - 45 g, 3 zakjes
-
Chinese tomaat - Cup a Soup
-
Bio Soup Potato - Maggi - 44 g
-
golden pumpkin soup - Maggi

-
Bey's Soup - Vispak - 60 g
-
Soupe chinoise - MAGGI

-
Cup a soup creamy tomato - Knorr - 4, 80 g
-
Sendations Cauli & Cheese - Continental - 62 g
-
Weiße Miso Suppe - 1pcs

-
Instant soup with chicken flavor - REEVA - 60g
-
Sopa de Letras - Kris - 65 g

-
Kremet blomkålsuppe - Toro - 4 porsoner

-
red Curry duck - 1pcs

-
Bean & bacon soup - Nutrisystem
-
Juha od rajčice s rezancima - Maggi - 62 g

-
tomato cream soup - eat easy and tasty - 1× po 65 g

-
Potage de pommes de terre - Prix Garantie - 4 x 150 ml
-
Sopa preparada de Estrellas - Knorr - 143 g
-
Sopa preparada de fideos - Knorr - 143g
-
Quick Soup Pois - Knorr - 3 pcs
-
Nyponsoppa - Ekströms
-
Kokošja supa - Bingo - 60 g
-
Groentensoep - cook of the house - 2 x 62g
-
Cup a Soup - Erwt - Unox
-
Buchstabensuppe - 81 g
-
Poulet pas thaï - Oyakata - 93 g (180 g après préparation)

-
rajská polévka s těstovinami - Knorr - 67 g

-
Batchelors

-
Soupe au pistou à l’huile d’ olive - Knorr - 240 g

-
Soupe Avengers Tomate - Knorr - 164 g

-
Tomaten-Mozzarella Suppd - Maggi - 1pcs
-
Erin Hotcup Chicken
-
Natur goveđa kocka - Vegeta - 6x10g
-
Tomato, ginger, garlic soup - Royco

-
Zwiebelsuppe - Le Gusto - 750 ml
-
Žampionová polévka - Knorr
-
Spicy Mongolian ramen noodle bowl - Aldi
-
Jókai bableves - Maggi - 63 g

-
Pievagrybių sriuba - Maggi

-
Bouillon legumes - Knorr - 160 g

-
Knr deshy dou aspe lotx3 - Knorr - 288 g

-
Crema sabor Pollo - Maggi - 72 g

-
Pasta Basta kari - kuřecí - Kania - 70 g
-
Tomato instant soup with noodles - Rimi express - 21 g
-
Farmářská polévka čočková - Vitana - 125 g

-
Mushroom instant soup with croutons - Rimi express - 16 g
-
Creamy Chicken instant soup with croutons - Rimi express - 16 g
-
Cream of Vegetable Soup - Knorr - 44g
-
Minestrone soup in a cup - Essential Waitrose - 4 x 18 g
