Fish preparations
Nutrition facts
Average nutrition facts for the 4526 products of the Fish preparations category for which nutrition facts are known (out of 4801 products).
| Nutrition facts | As sold for 100 g / 100 ml |
Standard deviation | Minimum | 10th centile | Median | 90th centile | Maximum |
|---|---|---|---|---|---|---|---|
| Energy |
812 kj (195 kcal) |
211 kj (51 kcal) |
0 kj (0 kcal) |
472 kj (113 kcal) |
818 kj (196 kcal) |
1,160 kj (278 kcal) |
3,820 kj (1200 kcal) |
| Fat | 11.6 g | 5.94 g | 0 g | 4 g | 10 g | 22.2 g | 92 g |
| Saturated fat | 2.51 g | 2.4 g | 0 g | 0.4 g | 1.5 g | 7.9 g | 54 g |
| Monounsaturated fat | 3.14 g | 1.73 g | 0.1 g | 1.46 g | 2.6 g | 6.9 g | 24 g |
| Polyunsaturated fat | 4.43 g | 2.01 g | 0.1 g | 0.9 g | 5.49 g | 6.98 g | 16 g |
| Omega 3 fat | 600 mg | 712 mg | 0 mg | 62 mg | 187 mg | 2,100 mg | 97,100 mg |
| Trans fat | 0 g | 0 g | 0 g | 0 g | 0 g | 0 g | 0.1 g |
| Cholesterol | 31.5 mg | 12.9 mg | 8 mg | 12 mg | 33 mg | 67 mg | 393 mg |
| Carbohydrates | 9.28 g | 6.58 g | 0 g | 1.1 g | 9.5 g | 20 g | 171 g |
| Sugars | 1.41 g | 0.942 g | 0 g | 0.3 g | 1.2 g | 3.2 g | 50 g |
| Fiber | 0.891 g | 0.616 g | 0 g | 0 g | 0.8 g | 2.1 g | 14 g |
| Proteins | 11.5 g | 2.81 g | 0 g | 6.9 g | 12 g | 16 g | 69.6 g |
| Salt | 1.2 g | 0.444 g | 0 g | 0.62 g | 1.1 g | 2 g | 22 g |
| Alcohol | 0 % vol | 0 % vol | 0 % vol | 0 % vol | 0 % vol | 0 % vol | 0 % vol |
| Vitamin A | 1.09 µg | 5.89 µg | 0 µg | 0 µg | 0 µg | 0 µg | 8,500 µg |
| Vitamin D | 0.641 µg | 1.18 µg | 0 µg | 0 µg | 0 µg | 4 µg | 80 µg |
| Vitamin C (ascorbic acid) | 0.029 mg | 0.198 mg | 0 mg | 0 mg | 0 mg | 0 mg | 48 mg |
| Vitamin B12 (cobalamin) | 0.901 µg | 0.735 µg | 0 µg | 0.38 µg | 0.69 µg | 3.4 µg | 670,000 µg |
| Potassium | 218 mg | 47.2 mg | 105 mg | 160 mg | 209 mg | 288 mg | 365 mg |
| Calcium | 25.9 mg | 31.4 mg | 0 mg | 0 mg | 22 mg | 66.7 mg | 1,070 mg |
| Iron | 0.943 mg | 0.591 mg | 0 mg | 0.145 mg | 0.85 mg | 1.94 mg | 5.14 mg |
| Selenium | 112,000 µg | 447,000 µg | 0 µg | 9.8 µg | 13 µg | 1,900,000 µg | 9,700,000 µg |
| Iodine | 58.4 µg | 18.9 µg | 0 µg | 39.8 µg | 53 µg | 106 µg | 51,000,000 µg |
| Fruits‚ vegetables‚ nuts and rapeseed‚ walnut and olive oils | 4.84 % | 7.63 % | 0 % | 0 % | 0 % | 22.4 % | 52.2 % |
| Fruits‚ vegetables and nuts - dried | 0 % | 0 % | 0 % | 0 % | 0 % | 0 % | 0 % |
| Fruits‚ vegetables‚ nuts and rapeseed‚ walnut and olive oils (manual estimate from ingredients list) | 12.6 % | 7.53 % | 2 % | 4 % | 14.5 % | 25 % | 48.5 % |
4,758 products
-
Le moelleux - Fleury Michon - 500 g
-
28 bâtonnets de surimi - Nautica - 500 g
-
Le moelleux - Fleury Michon - 24 bâtonnets. 384g.
-
Bâton surimi - Pêche Océan - 500 g
-
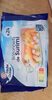
Surimi - Compagnie des Pêches Saint-Malo - 500 g
-
Le moelleux - Fleury Michon - 190 g
-
Rilette de thon - PETIT NAVIRE - 125 g

-
Croustibat - Findus
-
Paneerattu kalapuikko alaskanseitifileestä - Ocean Sea - 450 g
-
le Breizh Surimi - Compagnie des Pêches Saint-Malo - 200 g
-
Rillettes de saumon et de thon - PETIT NAVIRE - 125 g
-
Surimi - Atlantic - 405 g
-
Bâtonnets de surimi - Odyssée - 500 g
-
Colin d'Alaska MSC façon Fish & Chips - Findus - 400g (4 x 100g)
-
le moelleux - Fleury Michon - 512g

-
Rillettes de thon - petit navire - 220 g
-
Rillettes de thon aux olives vertes - Petit Navire - 125 g
-
Bonnets de crabe - Fleury Michon - 288 g.
-
Surimi Le Moelleux - Fleury Michon - 448g, 28 bâtonnets
-
Rillettes thon - Carrefour - 150 g

-
Bâtonnets de la mer goût crabe - U - x30 soit 500 g

-
Le Moelleux -25% de Sel - Fleury Michon - 230 g
-
bâtonnets de surimi - coraya l'original - 45 g
-
Colin d'Alaska MSC - 7 Céréales & Graines - Findus - 250 g (2 x 125 g)

-
Les Acras de morue - maison briau - 200g
-
Filet de limande du Nord façon meunière - Carrefour - 200 g

-
Carrefour - 466 g

-
L'Original - Bâtonnets de surimi - Coraya - 12 bâtonnets

-
2 panes au cabillaud - Atlantic - 200 g
-
Surimi - Carrefour - 300 g e
-
Suprêmes au Goût de Crabe - Coraya - 156 g

-
TK Fischstäbchen - Iglo - 15pcs
-
Tranches panées de Colin d'Alaska MSC - Findus - 400 g
-
Tranches panées de Cabillaud MSC - Findus - 510 g (10 panés)
-
Beaded cod - Birds Eye - 440g
-
Batonnet de surimi - Pêche Océan - 300 g
-
Colin d'Alaska façon Fish and Chips - Findus - 364 g

-
Cabillaud Façon Fish and Chips - LIDL - 200 g

-
Rillettes de Saumon - Carrefour - 150 g

-
Fish fingers - Birds Eye - 840g
-
Batonnets saveur crabe - PRIXMALIN - 400 g
-
Colin d'Alaska Extra croustillant MSC - Findus - 250 g
-
Tartinades de thon, tomates séchées et thym - Petit Navire - 125 g
-
2 Panés au colin d'Alaska MSC - Sans marque - 200 g (2 x 100 g)

-
Rillettes de thon - Nixe - 2 x 80 g
-
Surimi premium - - 180 g

-
Omega 3 Fish Fingers - Birds Eye - 280g
-
Omega 3 Fish Fingers - Birds Eye - 560g
-
Cod Fish Fingers - Birds Eye - 280g

-
Le moelleux - Fleury Michon - 190 g

-
24 Bâtonnets de Surimi - Golden Seafood - 400 g
-
Cabillaud façon Fish and chips - Findus - 400 g (4 x 100 g)

-
Croquettes de Poisson MSC Ail et Fines Herbes - Findus - 300g
-
Omega-3 Fish Fingers - Ocean Sea - 450g
-
Rillettes de thon - Carrefour - 220 g

-
Breaded omega 3 fish fingers - The Fishmonger - 450 g
-
façon Meunière légèrement fariné avec une pointe de persil - Findus - 2
-
Tartinable Thon MSC Fromage Frais & Ciboulette - Cap Océan - 140 g
-
Tartinades de thon - Duo de poivrons & tomates - Petit Navire - 125 g

-
Bâtonnets de Surimi - Ronde des Mers - 400 g
-
Filets de merlu blanc du cap - - 220 g

-
Rillettes de saumon - Ronde des Mers - 150 g

-
Tranches panées de Colin d'Alaska - findus - 510 gr

-
Filets de colin d'Alaska - L'Atelier Poissonnerie - 220 g
-
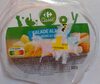
Salade Alaska Aux Surimi et Ananas 🍍 - Carrefour-classic - 300 g
-
Paté fish spread tuna - RIO MARE - 100g

-
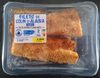
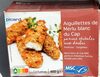
Aiguillettes de Merlu blanc du Cap - Picard - 400 g e
-
Rillettes de saumon rose du pacifique - Nixe - 2 x 80 g
-
Filets de limande du Nord meunière - ATLANTIC - 200 g
-
4 filets de cabillaud panure croustillante - Picard - 500 g
-
Accras de morue recette "créole" - Cité Marine - 200 g

-
Préparation à base de chair de poisson saveur crabe - U - boite de 21 soit 350 g

-
Alaska Seelachs Brotaufstrich - Feinkost Popp - 250g

-
Rillettes de Saumon - Cap Ocean - 150 g
-
Bâtonnets de surimi - Odyssée - 800 g
-
Filet de Merlu blanc du Cap façon meunière - Picard - 400 g
-
Ronde des Mers - 150 g
-
Tranches panées de Cabillaud MSC - Findus
-
4 portions de Colin d'Alaska - Picard - 500 g
-
Filets de colin d'Alaska - Cité marine - 220 g

-
2 croques saumons pomme de terre et légumes - LIDL - 200 g

-
Bâtonnets de surimi - Odyssée - 400 g
-
Filet de limande du Nord meunière - U - 200 g
-
2 dos de cabillaud façon fish and chips - Picard - 250 g

-
Panés au poisson - Simpl - 200 g

-
Limande du nord meunière - MSC LIDL - 200 g
-
Croustibat Petits Trésors - Findus - 450 g
-
Thon Piquant tartinable - Delicemer - 120 g
-
Filets de colin d'Alaska - L'Atelier Poissonnerie - 200 g
-
Surimi - CARREFOUR CLASSIC'
-
Rillettes de thon blanc - Reflets de France - 125 g
-
Limande du Nord - Atlantic - 200 g
-
Bastoncini di polpa di pesce - Greenland Seafood - 450g

-
Bâtonnets Colin d'Alaska MSC - Findus - 448 g
-
Surimi sin gluten - Krissia - 200 g

-
Petits Coraya avec sauce mayonnaise - 210 g
-
Pané de colin d'alaska 100% filet - Ocean Sea - 400 g
-
Youngs Salt Pepper Basa Fillets 2pk - 2

-
L'Original - Coraya - 315g / 21 portion

-
Poisson pané - Carrefour - 450 g (15 x 30 g)
