Frozen ready-made meals
Belongs to:
Contains:
Nutrition facts
Average nutrition facts for the 2745 products of the Frozen ready-made meals category for which nutrition facts are known (out of 2806 products).
| Nutrition facts | As sold for 100 g / 100 ml |
Standard deviation | Minimum | 10th centile | Median | 90th centile | Maximum |
|---|---|---|---|---|---|---|---|
| Energy |
609 kj (144 kcal) |
225 kj (53 kcal) |
25.3 kj (0 kcal) |
297 kj (70 kcal) |
561 kj (134 kcal) |
1,050 kj (249 kcal) |
2,900 kj (693 kcal) |
| Fat | 6.51 g | 3.62 g | 0 g | 1.9 g | 5.7 g | 14 g | 57 g |
| Saturated fat | 2.36 g | 1.79 g | 0 g | 0.4 g | 2 g | 6.1 g | 26.9 g |
| Monounsaturated fat | 2.88 g | 1.65 g | 0.1 g | 0.1 g | 3.4 g | 5 g | 8 g |
| Polyunsaturated fat | 1.82 g | 1.37 g | 0.1 g | 0.362 g | 1.5 g | 5.5 g | 7.32 g |
| Omega 3 fat | 53,900 mg | 214,000 mg | 0 mg | 0 mg | 200 mg | 910,000 mg | 963,000 mg |
| Trans fat | 0.036 g | 0.057 g | 0 g | 0 g | 0 g | 0.158 g | 1 g |
| Cholesterol | 13.5 mg | 9.98 mg | 0 mg | 0 mg | 13.2 mg | 31 mg | 83.3 mg |
| Carbohydrates | 13.4 g | 6.47 g | 0 g | 3.6 g | 13 g | 24.1 g | 74.1 g |
| Sugars | 2.16 g | 1.13 g | 0 g | 0.6 g | 2 g | 4.2 g | 37.4 g |
| Fiber | 1.65 g | 0.782 g | 0 g | 0.6 g | 1.5 g | 3.1 g | 13 g |
| Proteins | 6.5 g | 2.85 g | 0.2 g | 2.3 g | 6.2 g | 12 g | 51 g |
| Salt | 0.774 g | 0.259 g | 0 g | 0.41 g | 0.74 g | 1.27 g | 863 g |
| Alcohol | 0 % vol | 0 % vol | 0 % vol | 0 % vol | 0 % vol | 0 % vol | 0 % vol |
| Vitamin A | 118 µg | 113 µg | 0 µg | 0 µg | 93.4 µg | 406 µg | 765 µg |
| Vitamin D | 0.369 µg | 0.741 µg | 0 µg | 0 µg | 0 µg | 4 µg | 4 µg |
| Vitamin C (ascorbic acid) | 5.72 mg | 6.4 mg | 0 mg | 0 mg | 3.35 mg | 21.1 mg | 23.5 mg |
| Potassium | 164 mg | 57.3 mg | 31 mg | 97.9 mg | 157 mg | 250 mg | 765 mg |
| Calcium | 52.9 mg | 41.7 mg | 0 mg | 11 mg | 39.5 mg | 133 mg | 200 mg |
| Iron | 1.22 mg | 0.557 mg | 0.09 mg | 0.559 mg | 1 mg | 2.12 mg | 4.42 mg |
| Fruits‚ vegetables‚ nuts and rapeseed‚ walnut and olive oils | 32 % | 23.2 % | 0 % | 3.7 % | 24.4 % | 80 % | 100 % |
| Fruits‚ vegetables and nuts - dried | 0.091 % | 0.293 % | 0 % | 0 % | 0 % | 1.08 % | 3.42 % |
| Fruits‚ vegetables‚ nuts and rapeseed‚ walnut and olive oils (manual estimate from ingredients list) | 31.6 % | 21.5 % | 0 % | 8 % | 24 % | 74 % | 100 % |
2,806 products
-
Arroz con pollo - Hacendado - 600g

-

-
Korean Noodles - Lazy Vegan - 450 gram
-
Tesco
-
Cuscuz com Quinoa e Vegetais - Continente - 300g

-
Poêlée a l’espagnole - Casino

-
Крем-суп томатный замороженный - ВкусВилл - 1000g

-
Yakatori poulet - Monoprix - 250 g

-
Baingan Bharta - Trader Joe's - 10 oz
-

-
4 Effeuillés de pomme de terre au beurre et sel de Guérande - L'Atelier des Saveurs - 360 g

-

-
noix de saint jacques et crevettes nordiques - cora - 2x110g

-
chicken and bacon hotpot - slimming world - 550g

-
sweet and sour chicken - slimming world - 500g
-
4 Effeuillés de pomme de terre à la Sarlandaise - L'Atelier des Saveurs - 360 g

-

-
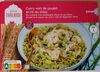
Curry vert de poulet et riz au shiso - Picard - 350 g
-
Pad Krapao - Picard

-
Chicken Tikka Masala - Lidl - 400 g

-
350 g

-
Silpancho de Garbanzo - Higa
-
Sweet Potato Burrito -

-
Meatball Marinara Bowl - Gardein - 1 Bowl
-
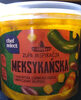
Zupa inspiracja meksykańska - Chef select - 450 g
-
Борщ вегетарианский - ВкусВилл - 1000 g
-
Chicken Korma - Lidl

-
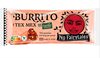
Burrito texmex - No fairytales - 171 gram
-
Filet mignon de porc , purée de patate douce et oignons compotés - ÉcoMiam - 330g

-
Minestrone Saporito Surgelato - Carrefour - 600g
-
Arrosto di lonza di maiale con patate a spicchi - Coop - 300 g
-
Ravioli a la courge butternut - Picard - 300 g e
-
Cabillaud en croûte de noisettes - Picard - 350 g

-
Orzo pasta in Italian Inspired Dressing - Tesco - 400g
-
Vegetable pad thai with noodles - Tuk tuk - 320 g

-
Garlic & Herb Salmon Darnes - Dunnes Stores
-

-
Gnocchi, légumes et sauce au chorizo - Thiriet - 600 g
-
Суп-пюре с грибами - ВкусВилл - 270 g

-
Potage de légumes variés et assaisonné

-
Meatball pasta bake - Spar

-
Lasanha de Frango - Copacol - 600 g

-
Чебуреки растительные - Foodgital - 360 g
-
Зразы картофельные с бобами - ООО «Гурман» - 2000 g
-
Soupe de moules - Picard

-
Arroz negro - Hacendado - 600 g

-
Суп томатный с сельдереем - ВкусВилл - 200 g

-
Zupa pomidorowa z makaronem - Hortex
-
395 g

-
Vegan lentil ragu - Zizzi - 400g
-
-
Veggie Schlemmerfilet à la Bordelaise - Frosta - 360g

-
Findus roasted chicken fillet - 390 g
-
Mamma Emma Caprese Potato Gnocchi - 350 g
-
Curried Chickpeas - Stocked - 70g per cube and 8 cubes total

-
Chilli con Carne with Peppers & Brown Rice - Mindful Chef - 400g

-
Spaghetti Marinara - Compliments - 255 g
-
Poulet basquaise piperade confite - - 330 g
-
Kichererbsen Curry mit Tomaten-Kräuter-Bulgur - Vasco&James - 400g
-
Yakitori, chicken and rice - Slimming world

-
Fish cuisine broccoli - Iglo
-
Moroccan style chickpea and red pepper tangine - deliciously Ella - 300g
-
Dorade sauce beurre blanc, épinards à la crème et riz surgelés - Les Gamelles Gourmandes - 1 part - 330 grammes - 7 minutes au micro-ondes à 800W

-
Poulet roti pommes de terre fondantes - La cuisine des saveurs - 900 g
-
Poêlée méridionale - Freshona

-
Spanish Chicken and Roasted Potatoes - Charlie Bigham's - 388g
-
Tortellini - 1pcs
-
Korean BBQ Beef Bowl - Life Cuisine - 269g
-
Lemon Caper Chicken - Blue Flame Kitchen - 240 g
-
Express Vegetarian Meatballs - Blue Flame Kitchen - 300 g

-
Conchiglies au poulet - Lidl - 900g
-
Orecchiette con cime di rapa e salciccia - M'ama
-
Pâtes au colin d'Alaska et petits légumes sauce - La Compagnie Arctique - 800 g

-

-
Grandiosa Mexicana - 340 g
-
Hamburguesa de Res PREMIUM - Sofía - 600 g (4 x 150 g)

-
Hamburguesa de Res Clásica - Sofía - 166 g (2 x 83 g)
-
Chicken Tikka - Sainsbury's flourish - 400g

-
Carrot Dal - 1pcs

-
General Tso’s Chicken - Innovasian - 18 oz
-
Chicken Korma - Charlie Bigham’s - 403g
-
Veggie Meal Cevada Ervilhas e Espinafres - Continente - 350 g
-
Pfannenfisch mit gemuse - Jütro - 275g
-
Dumplings med Grönsaker - Orkla - 200 g

-
Dumplings med Kyckling - Orkla - 200 g

-
Angus Beef & Pork Meatball Rigatoni - woolworths - 1.3kg
-
Boulette de poisson farcie au Champignon - PFP

-
Boulette de poisson farcie à la seiche - PFP

-
Fridosita de Res - Fridosa - 166 g (2 x 83 g)
-
Poêlée paysanne - Thiriet - 600 g

-
Chicken-Pops mit Sweet-Chili-Dip - Speisezeit - 240 g

-
Fitness Bowl - Culinea - 1pcs
-
Fusilli pomodoro e basilico - Zini - 300 g

-
Japanese Style Pork Belly - 1
-
Cauliflower Curry & Lentils - Suhki's

-
Rántott trapista sajt petrezselyemmel és fokhagymával - Culinea - 500g

-
Sweet Sriracha - H-E-B
-
Carbonade flamande et röstis de pommes de terre - Picard
-
Gunpowder potatos - Marks & Spencer

-
Curry vert au tofu et riz thaï - Thiriet - 350 g