Green olives - Page 2
Belongs to:
Olives, Plant-based pickles, Olive tree products, Pickles, Plant-based foods, Plant-based foods and beverages
Contains:
Nutrition facts
Average nutrition facts for the 2128 products of the Green olives category for which nutrition facts are known (out of 2286 products).
| Nutrition facts | As sold for 100 g / 100 ml |
Standard deviation | Minimum | 10th centile | Median | 90th centile | Maximum |
|---|---|---|---|---|---|---|---|
| Energy |
669 kj (161 kcal) |
108 kj (26 kcal) |
0 kj (0 kcal) |
515 kj (125 kcal) |
649 kj (156 kcal) |
874 kj (212 kcal) |
4,820 kj (1150 kcal) |
| Fat | 15.8 g | 2.6 g | 0 g | 11.7 g | 15.9 g | 20 g | 100 g |
| Saturated fat | 2.62 g | 0.637 g | 0 g | 1.5 g | 2.7 g | 3.6 g | 16.6 g |
| Monounsaturated fat | 10.6 g | 5.37 g | 0.91 g | 6.67 g | 10 g | 17.9 g | 75.6 g |
| Polyunsaturated fat | 1.15 g | 1.33 g | 0 g | 0 g | 0.9 g | 4 g | 8.2 g |
| Omega 3 fat | 1,260 mg | 273 mg | 860 mg | 860 mg | 1,300 mg | 2,700 mg | 2,700 mg |
| Omega 6 fat | 3,010 mg | 1,060 mg | 1,100 mg | 1,100 mg | 3,610 mg | 5,300 mg | 5,300 mg |
| Trans fat | 0 g | 0 g | 0 g | 0 g | 0 g | 0 g | 0.2 g |
| Cholesterol | 0 mg | 0 mg | 0 mg | 0 mg | 0 mg | 0 mg | 33 mg |
| Carbohydrates | 1.47 g | 1.72 g | 0 g | 0 g | 0.9 g | 5.1 g | 79 g |
| Sugars | 0.187 g | 0.256 g | 0 g | 0 g | 0 g | 0.5 g | 50 g |
| Added sugars | 0 g | 0 g | 0 g | 0 g | 0 g | 0 g | 0 g |
| Fiber | 2.9 g | 1.4 g | 0 g | 0 g | 2.9 g | 5.1 g | 26 g |
| Proteins | 1.22 g | 0.454 g | 0 g | 0.7 g | 1.2 g | 1.9 g | 19 g |
| Salt | 3.35 g | 0.703 g | 0 g | 2.17 g | 3.42 g | 4.5 g | 28 g |
| Alcohol | 0 % vol | 0 % vol | 0 % vol | 0 % vol | 0 % vol | 0 % vol | 1.4 % vol |
| Vitamin A | 50.7 µg | 87.3 µg | 0 µg | 0 µg | 0 µg | 200 µg | 1,000 µg |
| Vitamin C (ascorbic acid) | 4.82 mg | 13.6 mg | 0 mg | 0 mg | 0 mg | 34 mg | 70 mg |
| Calcium | 19.4 mg | 39.9 mg | 0 mg | 0 mg | 0 mg | 125 mg | 333 mg |
| Iron | 0.393 mg | 1 mg | 0 mg | 0 mg | 0 mg | 2.57 mg | 7.2 mg |
| Fruits‚ vegetables‚ nuts and rapeseed‚ walnut and olive oils | 76.4 % | 38.7 % | 0 % | 0 % | 97.4 % | 100 % | 100 % |
| Fruits‚ vegetables‚ nuts and rapeseed‚ walnut and olive oils (manual estimate from ingredients list) | 96.9 % | 2.95 % | 56.5 % | 92 % | 98 % | 100 % | 100 % |
2,285 products
-
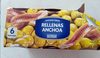
Aceitunas manzanilla rellenas de anchoa - Baresa - 350
-
Aceitunas sin hueso - Hacendado - 835 g

-
OLIVE VERTE DENOYAUTEE PROVENCALE HERBES DE PCE - Tropic Apero - 110 g

-
Olives vertes de Grèce - Tropic Apéro - 220 g

-
Olives vertes dénoyautées - Bouton d'or - 320 g
-
Olives vertes à la farce d'Anchois - La Ciota - 300 g

-
Olives vertes Dénoyautées - Cora - 320 g (160 g égoutté)
-
Olives vertes -
-
Aceitunas aliñadas estilo chupadedos
-
Olives vertes dénoyautées - 200 g

-
Baresa Green Olives with Chili and Pepper - 200 g
-
Grüne Oliven - Las Cuarenta/NETTO - 170g
-
Olives vertes à l'ail dénoyautées - Carrefour - 150 g
-
Aceituna manzanilla de anchoa s/poten - Carrefour - 150 g
-
Olives vertes entières - Leader Price - 320 g (égoutté : 200 g)
-
Les Olives du Marche - creSpo - 70 g

-
Olives - Tramier - 320 g

-
Manzanilla Olives with Anchovy - Fragata - 350 g
-
Ducros Green Pitted Olives 100g - 170 g
-
Baresa Green Olives with Salad Cheese - 200 g
-
Aceitunas verdes manzanilla sin hueso - Alipende
-
Olive verte Picholines - Le Brin d'olivier - 120g

-
Pitted Green Olives - asda - 165 g

-
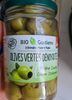
Grüne Oliven Bio - Gaea - 290g
-
Olives vertes dénoyautées à l'orientale au piment - Tropic Apéro - 110 g
-
Olives vertes dénoyautées - Bio Gustiamo
-
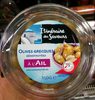
Olives Grecques dénoyautées à l'ail - Itinéraire des Saveurs - 150 g
-
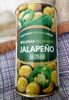
Aceitunas verdes rellenas de jalapeño - Hacendado - 350 g
-
Olives vertes dénoyautées - Biorganica Nuova

-
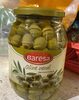
Olive verdi denocciolate - Baresa - 950 g
-
Olives vertes dénoyautées - Le Brin d'Olivier - 255 g (160 g égoutté)
-
Olives vertes farcies amandes - Crespo - 120 g

-
Olives vertes dénoyautées - 400 g

-
Olives vertes entières - Crespo - 354 g

-
ACEITUNAS PARTIDAS ALIÑADAS ESTILO CASERO - Hacendado - 940 g
-
Olives vertes cassées à l'ail - Tropic Apéro - 450 g e

-
Bio olives vertes dénoyautées à l ail - père olive
-
Oliv Denfarci Mediterr Ai - Tropic apero - 110 g
-
Olives apero - Tramier - 150 g (Poids net égoutté)

-
Grüne Oliven mit rotem Paprika
-
Olives vertes dénoyautées - Les Saveurs de Savino - 350 g
-
Olives farcies aux anchois - Menguy's - 150 g
-
Aceitunas rellenas -

-
Olives vertes à la farce d'anchois - Belca - 300 g poids net (120 g poids net égoutté)
-
Glas Oliven grün gefüllt mit Knoblauch - Baresa - 220g
-
Olives vertes fourrées aux amandes - Le Brin d'Olivier - 340 g (égoutté : 200 g)
-
Aceitunas rellenas de anchoa - Eroski - 150 g (350 g peso neto)

-
Cocktail olives & lupins 170g - Menguy's - 170 g

-
Olives vertes dénoyautées - Carrefour Discount - 600 g (égoutté : 320 g)

-
Aceitunas manzanilla rellenas de anchoa - Baresa

-
Hand picked colossal olives - Specially selected
-
Grüne Oliven mit Mandeln gefüllt - ERIDANOUS - 350 g

-
Olives vertes en rondelles - Bio Gustiamo - 280 g (140 g égoutté)

-
Olives vertes entières - Les saveurs de savino - 360 g
-
Aceitunas benefit - Serpis
-
Aceituna manzanilla - De nuestra tierra - 318 g
-
Aceitunas gazpacha - Hacendado - 835g
-
Oliven , grün - Feinkost Dittmann - 160g
-
Olives vertes rondelles - Auchan - 0.11 kg
-
Aceitunas rellenas de anchoa - Hacendado - 720g
-
Olives vertes Picholine du Gard - Le brin d olivier - 270 g

-
Aceitunas sin hueso Pack 3 - Hacendado - 480g

-
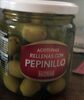
Aceitunas rellena con pepinillo - Hacendado - 340g
-
Aceitunas rellenas de anchoa - Hacendado - 1050 g

-
Olives vertes farcies au poivron et piments coupés - Le Brin d'Olivier - 150g

-
Olive fraiche - Ansolive - 200 g
-
Olives vertes entières - Tramier - 355 g (poids net total) - 200 g (poids net égoutté)

-
Olives Picholines vertes - Itinéraire des Saveurs - 350 g
-
Grüne Oliven - Rewe - 320g
-
Picholines du bassin méditerranéen - Reflets de France - 300 g

-
Olives Picholine Royale Gard - Le Brin d'Olivier - 200g
-
Aceitunas verdes rellenas anchoas (reducida en sal) - Hacendado - 350 g

-
Minut Apero - Carrefour - 125 g

-
oliven - Casa Morando (Aldi) - 300 g
-
Olives vertes entières - U - 37 cl, 200 g

-
Aceitunas verdes rellenas de pimiento rojo - El Cultivador - 350 g (neto), 150 g (escurrido), 370 ml

-
Aceitunas Rellenas Extra Espinaler
-
Olives vertes dénoyautées - Pouce - 0.65 kg
-
Manzanilla Oliven mit Jalapeño Creme - Kattus - 200g
-
Olives Vertes Entières En Saumure - Crespo - 200 g

-
Olives vertes dénoyautées aux herbes de Provence - Auchan Bio - 0.335 kg
-
Olives vertes entières - Pouce - 0.65 kg
-
Olives Vertes saveur provençale - Le Brin d'Olivier - 150g
-
Olives vertes à l'ail, dénoyautées - Croc' frais

-
Aceitunas Gazpacha - Baresa - 950 g (neto), 600 g (escurrido), 960 ml
-
Olives vertes denoyautees - Belle France - 160 g
-
Oliven - Rewe - 160g

-
OLIVE VERTE DENOYAUTEE A LA SICILIENNE - Tropic Apero - 220 g
-
Aceitunas Verdes Rellenas De Anchoa - Hacendado

-
Olives Vertes à la farce d'anchois - Crespo - 198g
-
Olives Vertes Dénoyautées à l'Ail et aux Fines Herbes - Père Olive - 150 g e

-
Olives vertes farcies à l'Ail - Le Brin d'Olivier
-
Olives vertes bio ail & persil - Tramier - 280 g
-
Aceitunas verdes estilo chupadedos - Huerta de Barros - 350g
-
Aceitunas verdes - Hacendado - 1pcs
-
Olivas verdes - REWE Bio - 350g
-
Olives aux amandes farcies doux - Croc’frais - 200 g
-
Olives farcies à la pâte d'anchois - Croc frais - 200g

-
spanische Manzanilla Oliven - Las Cuarenta - 170 g (340 g)
-
Olives vertes dénoyautées - Eco+ - 640 g (320 g)
