Meals with chicken
Nutrition facts
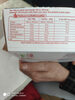
Average nutrition facts for the 3081 products of the Meals with chicken category for which nutrition facts are known (out of 3230 products).
| Nutrition facts | As sold for 100 g / 100 ml |
Standard deviation | Minimum | 10th centile | Median | 90th centile | Maximum |
|---|---|---|---|---|---|---|---|
| Energy |
603 kj (145 kcal) |
159 kj (39 kcal) |
4 kj (1 kcal) |
397 kj (95 kcal) |
573 kj (137 kcal) |
912 kj (219 kcal) |
3,420 kj (818 kcal) |
| Fat | 5.72 g | 2.88 g | 0 g | 2.1 g | 5.1 g | 11 g | 73.7 g |
| Saturated fat | 1.64 g | 1.05 g | 0 g | 0.4 g | 1.4 g | 3.67 g | 24 g |
| Monounsaturated fat | 2.32 g | 1.38 g | 0.001 g | 0.39 g | 2.8 g | 4.3 g | 4.8 g |
| Polyunsaturated fat | 1.72 g | 0.932 g | 0.029 g | 0.39 g | 1.9 g | 6.1 g | 7.69 g |
| Trans fat | 0.032 g | 0.058 g | 0 g | 0 g | 0 g | 0.167 g | 0.5 g |
| Cholesterol | 20.2 mg | 12.3 mg | 0 mg | 5.88 mg | 16 mg | 46.4 mg | 104 mg |
| Carbohydrates | 13.5 g | 5.47 g | 0 g | 4 g | 14 g | 22 g | 82.5 g |
| Sugars | 2.07 g | 1.17 g | 0 g | 0.6 g | 1.9 g | 4.3 g | 65 g |
| Fiber | 1.39 g | 0.623 g | 0 g | 0.5 g | 1.3 g | 2.6 g | 23 g |
| Proteins | 8.02 g | 2.59 g | 0 g | 5.1 g | 7.3 g | 13.4 g | 62 g |
| Salt | 0.818 g | 0.286 g | 0 g | 0.425 g | 0.78 g | 1.4 g | 27.7 g |
| Alcohol | 0 % vol | 0 % vol | 0 % vol | 0 % vol | 0 % vol | 0 % vol | 0.1 % vol |
| Vitamin A | 108 µg | 133 µg | 0 µg | 0 µg | 66 µg | 477 µg | 16,900,000 µg |
| Vitamin C (ascorbic acid) | 5.48 mg | 4.79 mg | 0 mg | 0.7 mg | 3.5 mg | 17 mg | 43.2 mg |
| Vitamin B1 (Thiamin) | 262 mg | 569 mg | 0 mg | 0 mg | 0.027 mg | 1,670 mg | 6,980 mg |
| Vitamin B2 (Riboflavin) | 0.063 mg | 0.09 mg | 0 mg | 0 mg | 0.024 mg | 0.283 mg | 23.1 mg |
| Potassium | 166 mg | 61.1 mg | 40 mg | 92 mg | 158 mg | 378 mg | 730 mg |
| Calcium | 29.9 mg | 26.4 mg | 0 mg | 7.86 mg | 20 mg | 104 mg | 22,500 mg |
| Iron | 0.795 mg | 0.556 mg | 0 mg | 0.294 mg | 0.6 mg | 2.32 mg | 607 mg |
| Fruits‚ vegetables‚ nuts and rapeseed‚ walnut and olive oils | 16.1 % | 12 % | 0 % | 0 % | 16 % | 35.7 % | 61.9 % |
| Fruits‚ vegetables and nuts - dried | 0.477 % | 1.05 % | 0 % | 0 % | 0 % | 4.5 % | 25 % |
| Fruits‚ vegetables‚ nuts and rapeseed‚ walnut and olive oils (manual estimate from ingredients list) | 18.7 % | 8.73 % | 0 % | 6.1 % | 19 % | 34 % | 56.5 % |
3,226 products
-
Couscous Oriental légumes cuisinés et poulet émincé - WW - 300 g
-
Poulet🐔 au Curry et Noix de Coco 🥥 - WW - 300 g
-
Salade & Compagnie - Manhattan - pâtes, crudités, œuf, poulet rôti, carottes et fromage. - Sodebo - 320g
-
Penne au Poulet et au Pesto - Marie - 270 g
-
Brulle fraîcheur - Daunat - 250 g
-
Risotto au poulet & cèpes à la crème fraîche - Fleury Michon - 280 g

-
Poulet au curry et au lait de coco, duo riz - Picard - 300 g
-
Tagliatelles au Poulet 🐔, Champignons🍄Crème - WW - 300 g
-
Mon atelier salade - Poulet caesar - Sodebo - 240 g
-
Quinoa poulet sésame - Jardin bio - 250 g

-
Aiguillettes de poulet au miel et épices, semoule et légumes - Picard - 330 g
-
Poulet et mini-Farfalles, Sauce aux 3 Fromages - Picard - 300 g
-
Aiguillettes de poulet à la moutarde et au citron, écrasée de pommes de terre et carottes - Picard - 350 g e

-
Le Filet de Poulet et ses Pommes de Terre à la Sarladaise - Fleury Michon - 300 g
-
Poulet et petites pâtes sauce aux champignons - Picard - 300 g

-
La Paëlla Valenciana, poulet rôti, chorizo et fruits de mer - Fleury Michon - 400 g
-
Blanquette de poulet - WW - 300 g
-
Salade poulet rôti bacon fromage - Sodebo - 320g
-
Poulet & Purée de Courgettes pointe de crème fraîche - Fleury Michon - 300 g

-
Risotto au poulet et aux cèpes - Toque du Chef - 280 g

-
Champêtre poulet rôti & emmental mimolette - Daunat - 320g
-
Le Kebab de Poulet et sa Semoule à l'Orientale - Fleury Michon - 280 g
-
Émincés de poulet conchiglie complètes et légumes à l'italienne - Picard - 350 g e
-
Poulet sauce citron vert et coriandre, purée de patate douce - Picard - 300 g e
-
POULET BASQUAISE, RIZ ET COURGETTES WW 300G - 300 g
-
Couscous poulet et merguez - Toque du Chef - 375g
-
Salade Bol Caesar Mix - 250g

-
Riz à la Forestière, poulet rôti - WILLIAM SAURIN - 300 g

-
Salade Coffret Poulet Avocat MIX - 320g

-
Poulet au curry au lait de coco - LES LÉGENDAIRES - 300 g
-
Butter chicken et riz pilaf - Picard - 350 g e
-
Tailor Classic Butter Chicken - The Spice Tailor - 300g

-
Salade coffret Poulet pané Caesar - Mix Buffet

-
Albondigas de pollo - Hacendado
-
Tartinable - Poulet nature - Delicato - 200g
-
Nouilles à la Chinoise au Poulet, légumes croquants - Marie - 900 g e
-
Poulet tikka masala avec riz - P[V]RE - 400 g

-
Poulet sauce tandoori et riz aux épices - Picard - 300 g
-
Pizza Crust Farmer - Sodebo - 600 g

-
Thaï - Salade de pâtes vermicelles aux légumes et poulet traité en salaison cuit rôti - Pierre Martinet - 250 g

-
Salade Coffret Poulet & PIPE RIGATE - Mix - 320g

-
Escalope milanaise & spaghetti à la sauce tomate - Fleury Michon - 300 g

-
Couscous Royal Poulet & Boeuf - Garbit - 800 + 180 g

-
Nasi Goreng - Toque du Chef - 350 g

-
Émincés de poulet, tagliatelles complètes et légumes façon wok - Picard - 350 g e
-
Seafood & chicken paella - Lidl - 750g
-
Couscous poulet et curcuma - Jardin bio - 220 g

-
Poulet Curry Coco riz blanc - Garbit - 300 g
-
Destination Asie Curry Vert - Garbit - 300 g
-
Tagliatelles au Poulet tomates et basilic crème & basilic - Fleury Michon - 300 g

-
Poulet rôti et sa purée à l'Ancienne - La Cuisine d'Océane - 300 g

-
Pasta salade - Sodebo - 250 g

-
Poulet Tikka et riz basmati - Picard - 350 g
-
Poulet à la crème et aux champignons, farfalles - Marie - 280 g

-
Couscous Poulet Merguez - Carrefour - 440 g
-
Hachés de Poulet Rôtis - Maître Coq - 180 g

-
Tajine de poulet🐔 - Fleury Michon - 300g e
-
Gnocchetti au poulet crème de parmesan - Marie - 300 g

-
Poulet rôti frites dorées au four - Fleury Michon - 280 g

-
Nems poulet - Carrefour - 280 g
-
Aiguillettes de poulet aux épices tandoori - Picard - 350 g e
-
Le Poulet tandoori semoule aux petits légumes - Fleury Michon - 280 g

-
Risotto au Poulet et Champignons à la crème - Marie - 900 g
-
Bo bun - Picard - 350 g

-
Chicken Gyoza Dinner Dumplings - Itsu - 240 g
-
Poulet Yassa - Picard - 350 g
-
Poulet tomates purée courgettes - Côté Table - 300 g
-
Le Couscous à la Marocaine et ses légumes - Fleury Michon - 450 g
-
Couscous poulet merguez - Côté Table - 450 g
-
Poulet Tikka Massala duo riz quinoa - Garbit

-
Piémontaise au Poulet rôti - Bonduelle - 320 g
-
Japchae au poulet - picard - 350 g e
-
4 Nems au poulet avec sauce nuoc-mâm - Traditions d asie - 280 g
-
Paella Royale, Surgelé - Côté Table - 1 kg
-
4 nems au poulet - TOQUE DU CHEF - 280 g
-
Poulet rôti et purée de pommes de terre - Carrefour Extra - 300 g
-
Cannellini di carne - Hacendado - 600 g
-
Poulet au riz Côté table - 300 g

-
Soupe pho - Picard - 350 g

-
Bami Goreng - Culinea - 750g
-
Asian favorites Satay chicken with noodles - für die Mikrowelle - 250g
-
Poulet Tikka Massala et riz basmati - weight watchers - 300 g
-
Salade et penne caesar - Lidl - 250 g

-
Couscous Royal poulet & merguez - Garbit - 800 + 180 g
-
Poulet curry et lait de coco - Marie - 300 g
-
Poulet sauce aux olives et quinoa Bio - Carrefour BIO - 300 g

-
Emincés de poulet sauce curry & son riz basmati - Lidl Toque du Chef - 280 g

-
Japanisches chicken teriyaki - Youcook - 420 g
-
Indian Style Butter Chicken mit Huhn - Youcook - 420 g

-
Le colombo de Poulet et son riz long - Fleury Michon - 300 g
-
8 Nems au Poulet et à la Coriandre (avec sauce Nuoc-Mâm) - Cuisine Évasion - 240 g
-
Piri piri chicken - The Gym Kitchen
-
BARQUETTE Poulet olives et quinoa - BIO - Monique ranou - 300 g
-
Nems au Poulet - Agis - 4 x 65 g
-
Poulet, Conchiglie, sauce au chorizo et légumes du soleil - Picard - 900 g

-
Wok&go poulet riz curry coco - Fleury Michon - 280 g
-
Poulet Basquaise au Piment du Pays Basque - Raynal & roquelaure - 300 g
-
Couscous à la Marocaine - Poulet et merguez - Garbit - 285 g
-
Pollo al curry - Hacendado - 280 g
-
Riz coco curry et poulet rôti - WILLIAM SAURIN - 300 g
