Meals with fish
Belongs to:
Contains:
Nutrition facts
Average nutrition facts for the 3293 products of the Meals with fish category for which nutrition facts are known (out of 3458 products).
| Nutrition facts | As sold for 100 g / 100 ml |
Standard deviation | Minimum | 10th centile | Median | 90th centile | Maximum |
|---|---|---|---|---|---|---|---|
| Energy |
678 kj (164 kcal) |
240 kj (60 kcal) |
0 kj (0 kcal) |
383 kj (92 kcal) |
623 kj (151 kcal) |
1,150 kj (278 kcal) |
3,400 kj (813 kcal) |
| Fat | 9.09 g | 5.42 g | 0 g | 2.7 g | 7.8 g | 20 g | 72 g |
| Saturated fat | 2.13 g | 1.57 g | 0 g | 0.4 g | 1.7 g | 5.3 g | 44 g |
| Monounsaturated fat | 2.75 g | 2.77 g | 0.1 g | 0.1 g | 1.54 g | 9.7 g | 10 g |
| Polyunsaturated fat | 2.38 g | 1.53 g | 0.1 g | 0.1 g | 2.35 g | 6.06 g | 7.6 g |
| Omega 3 fat | 843 mg | 1,060 mg | 0 mg | 100 mg | 375 mg | 4,100 mg | 60,000 mg |
| Trans fat | 0.003 g | 0.016 g | 0 g | 0 g | 0 g | 0 g | 1.88 g |
| Cholesterol | 28.2 mg | 13.9 mg | 0 mg | 8 mg | 30 mg | 60 mg | 120 mg |
| Carbohydrates | 9.38 g | 4.95 g | 0 g | 1.5 g | 9.5 g | 18 g | 93 g |
| Sugars | 1.49 g | 0.968 g | 0 g | 0.3 g | 1.3 g | 3.3 g | 27.6 g |
| Fiber | 1.21 g | 0.702 g | 0 g | 0 g | 1.18 g | 2.5 g | 31.6 g |
| Proteins | 8.52 g | 2.75 g | 0 g | 5.3 g | 7.9 g | 14 g | 72 g |
| Salt | 0.889 g | 0.292 g | 0 g | 0.48 g | 0.86 g | 1.48 g | 22 g |
| Alcohol | 0 % vol | 0 % vol | 0 % vol | 0 % vol | 0 % vol | 0 % vol | 0 % vol |
| Vitamin A | 33.8 µg | 50.9 µg | 0 µg | 0 µg | 26.4 µg | 165 µg | 388 µg |
| Vitamin C (ascorbic acid) | 0.93 mg | 0.975 mg | 0 mg | 0 mg | 1.2 mg | 2.8 mg | 26 mg |
| Calcium | 20.6 mg | 25.8 mg | 0 mg | 0 mg | 20 mg | 88 mg | 347 mg |
| Iron | 0.955 mg | 0.644 mg | 0 mg | 0.288 mg | 0.766 mg | 2.57 mg | 3,500 mg |
| Fruits‚ vegetables‚ nuts and rapeseed‚ walnut and olive oils | 18.2 % | 15.3 % | 0 % | 0 % | 16.4 % | 46.3 % | 64.8 % |
| Fruits‚ vegetables and nuts - dried | 0.135 % | 0.438 % | 0 % | 0 % | 0 % | 1.27 % | 36 % |
| Fruits‚ vegetables‚ nuts and rapeseed‚ walnut and olive oils (manual estimate from ingredients list) | 21.3 % | 11.4 % | 0 % | 5 % | 19.6 % | 40 % | 58 % |
3,449 products
-
28 bâtonnets de surimi - Nautica - 500 g
-
Bâton surimi - Pêche Océan - 500 g
-
BRANDADE DE MORUE - Briau - 750 g

-
Le moelleux - Fleury Michon - 190 g
-
Cod with lemon sauce - Rice with vegetables - Marie - 290 g e
-
Filet de Saumon Purée de Brocolis - Fleury Michon - 300 g

-
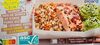
Salade & Compagnie - Antibes - sodebo - 320g

-
Riz à la Provençale au Thon & Basilic - Bonduelle - 320 g

-
Colin d'Alaska MSC façon Fish & Chips - Findus - 400g (4 x 100g)

-
Brandade de Morue parmentière 2 personnes - Pêcheries Basques - 900 g

-
Parmentier de saumon, sauce ricotta épinards - Fleury Michon - 300 g ℮
-
Penne au saumon et crème d'épinards - Marie - 280 g

-
Brandade de morue parmentiere gratinée - maison tino - 800 g

-
St Jacques fondue leeks Basmati rice - Marie - 280 g

-
Poisson à l'andalouse riz safrané et courgettes grillées - Marie - 300 g e
-
Saupiquet - Thon à la Catalane - 270 g (2 * 135 g e)
-
Parmentier de poisson à la ciboulette - Toque du Chef - 300 g

-
Petites St Jacques et torti - WW - 300 g
-
Parmentier de saumon 🐟 - Maison Briau - 750 g
-
Colin d'Alaska MSC - 7 Céréales & Graines - Findus - 250 g (2 x 125 g)

-
Insalatissime, Messicana - Rio Mare - 160g
-
Cabillaud fondue de poireaux, et riz aux graines de pavot - WW - 290 g
-
Salade Mexicaine au thon - nixe - 280 g
-
Tuno in Olive Oil - Rio Mare - 52g
-
Les Acras de morue - maison briau - 200g
-
Brandade de morue Parmentiere gratinée - 750 g
-
Salade à la mexicaine - Petit navire - 220 g

-
Suprêmes au Goût de Crabe - Coraya - 156 g

-
Cabillaud sauce vierge et duo de riz - Picard - 350 g
-
La brandade de Morue parmentière gratinée - Briau - 550g

-
Poisson à la Bordelaise & écrasé de pommes de terre - Fleury Michon - 300 g
-
Au Coeur de la région Piémontaise - Petit Navire - 220 g
-
BULLE FRAICHEUR THON OEUF CRUDITES - daunat - 250 g
-
Quenelles de brochet sauce Nantua - Petitjean - 400 g

-
Les saladieres mexicana - Saupiquet - 220 grammes
-
Dos de colin d'Alaska au risotto - Picard - 350 g
-
Rillettes de Saumon - Carrefour - 150 g

-
Colin d'Alaska sauce citron et son riz - Toque du Chef - 300 g
-
Colin d'Alaska Extra croustillant MSC - Findus - 250 g
-
Lasagnes au thon - Briau - 850 g
-
Parmentier de Poisson à la Ciboulette - Fleury Michon - 300 g

-
Rillettes de thon - Nixe - 2 x 80 g

-
Tuna Salad Mexican Style - NIXE - 220 g

-
Salade à la Catalane au Thon - Lidl - 220 g
-
Saumon aux épices tandoori, riz noir et petits légumes - Picard - 350 g e
-
24 Bâtonnets de Surimi - Golden Seafood - 400 g
-
Merlu blanc compotée à la provençale, linguine au safran - Marie - 300 g
-
Insalatissime Mais e Tonno - Rio Mare - 160 g
-
La Brandade ce morue parmentière - Maison briau - 650 gr

-
Nixe - 220 g
-
Salade Italienne au thon - Les Doris - 280 g e

-
Rillettes de thon - Carrefour - 220 g

-
Fish Pie - Charlie Binghams - 655g
-
Bâtonnets de Surimi - Ronde des Mers - 400 g
-
Saumon duo de guinoa et orge purée aux légumes verts - Picard - 300 g
-
Brandade de morue parmentière - U - 750 g
-
Brandade de morue parmentiere - Les plats à partager - 400g

-
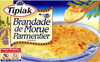
Brandade de morue - Tipiak - 1,05 kg
-
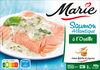
Saumon Atlantique à l'oseille - crème fraiche & oignons - Marie - 400 g
-
Rillettes de saumon - Ronde des Mers - 150 g

-
Colin d'Alaska à la bordelaise et riz aux légumes - Picard - 300 g
-
Saumon sauce Oseille et riz pilaf - William Saurin - 300 g
-
Filets de merlu blanc du cap - - 220 g

-
Tagliatelles au saumon à la crème ciboulette - Fleury Michon - 280 g
-
Quenelles de Saumon Sauce Océane - Petitjean - 400 g
-
Saumon sauce oseille & son riz pilaf - Toque du Chef - 300 g
-
Paté fish spread tuna - RIO MARE - 100g

-
Salade Alaska Aux Surimi et Ananas 🍍 - Carrefour-classic - 300 g
-
Accras de morue recette "créole" - Cité Marine - 200 g

-
Rillettes de saumon rose du pacifique - Nixe - 2 x 80 g
-
Hachés au saumon à la ciboulette - Peche Ocean - 200 g
-
Brandade de morue - Picard - 350 g e

-
Salade de pâtes - Saupiquet - 220 g
-
Risotto au saumon & épinards à la crème - Fleury Michon - 280 g
-
Petites Gambas & tagliatelles au basilic - Fleury Michon - 280 g
-
Linguine au Saumon et aux Épinards, sauce Citron Basilic - Picard - 300 g

-
Colin d'Alaska et petites St Jacques Pommes de terre en persillade - Marie - 900 g
-
Bâtonnets de surimi - Odyssée - 800 g
-
Filet de Merlu blanc du Cap façon meunière - Picard - 400 g
-
2 croques saumons pomme de terre et légumes - LIDL - 200 g

-
Salad'Bowl - Carrefour - 250 g

-
Bâtonnets de surimi - Odyssée - 400 g
-
Filet de limande du Nord meunière - U - 200 g
-
2 dos de cabillaud façon fish and chips - Picard - 250 g

-
Barquette 300g micro-ondable matelote thon aux petits legumes daucy - D'aucy - 300 g
-
Tortis Concombres & Saumon - Bonduelle - 300 g
-
Thon Piquant tartinable - Delicemer - 120 g
-
Saumon et Colin d'Alaska à l'oseille, pommes de terre - Picard - 300 g
-
Tuna salad - NiXe - 220g

-
Rillettes de thon blanc - Reflets de France - 125 g
-
Limande du Nord - Atlantic - 200 g
-
Tuna salad Mediterranean style - Nixe - 220g
-
Merlu blanc sauce au cidre et pommes de terre grenaille - Picard - 350 g
-
Colin d'Alaska - D'aucy - 300 g
-
Poisson pané - Carrefour - 450 g (15 x 30 g)

-
Tuna salad mexican style - Lidl - 220 g
-
Saumon Atlantique Fondue de poireaux - crème fraiche et estragon - Marie - 400 g
-
Salade américaine au thon - Carrefour discount - 260g

-
Salade bol thon oeuf - Select & Go Lidl - 250

-
Saumon pâtes au basilic et sauce citronnée - Lidl - 280 g
