Meat ravioli
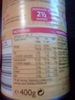
Nutrition facts
Average nutrition facts for the 553 products of the Meat ravioli category for which nutrition facts are known (out of 564 products).
| Nutrition facts | As sold for 100 g / 100 ml |
Standard deviation | Minimum | 10th centile | Median | 90th centile | Maximum |
|---|---|---|---|---|---|---|---|
| Energy |
596 kj (142 kcal) |
301 kj (72 kcal) |
264 kj (63 kcal) |
347 kj (83 kcal) |
418 kj (100 kcal) |
1,130 kj (269 kcal) |
1,950 kj (466 kcal) |
| Fat | 3.74 g | 1.83 g | 0.7 g | 1.7 g | 3.3 g | 7.5 g | 25 g |
| Saturated fat | 1.32 g | 0.717 g | 0 g | 0.5 g | 1.04 g | 2.76 g | 8.16 g |
| Monounsaturated fat | 1.29 g | 0.129 g | 0.77 g | 1.17 g | 1.25 g | 1.46 g | 1.76 g |
| Polyunsaturated fat | 0.349 g | 0.089 g | 0 g | 0.21 g | 0.41 g | 0.41 g | 0.7 g |
| Trans fat | 0 g | 0 g | 0 g | 0 g | 0 g | 0 g | 0.047 g |
| Cholesterol | 7.04 mg | 7.65 mg | 0 mg | 4 mg | 4 mg | 31 mg | 62 mg |
| Carbohydrates | 19.8 g | 10.7 g | 2 g | 11.5 g | 13.4 g | 40 g | 58 g |
| Sugars | 2.42 g | 0.858 g | 0 g | 1.23 g | 2.3 g | 4 g | 24 g |
| Fiber | 1.59 g | 0.523 g | 0 g | 0.8 g | 1.6 g | 2.6 g | 15 g |
| Proteins | 5.95 g | 3.06 g | 1.98 g | 3 g | 4.3 g | 11.4 g | 19 g |
| Salt | 0.901 g | 0.19 g | 0 g | 0.69 g | 0.85 g | 1.3 g | 2 g |
| Vitamin A | 31.7 µg | 17.9 µg | 0 µg | 23.7 µg | 24.9 µg | 74.1 µg | 354 µg |
| Vitamin C (ascorbic acid) | 0.656 mg | 0.572 mg | 0 mg | 0 mg | 1 mg | 1.8 mg | 10.6 mg |
| Vitamin B9 (Folic acid) | 247 µg | 4.27 µg | 244 µg | 244 µg | 246 µg | 256 µg | 256 µg |
| Potassium | 254 mg | 101 mg | 25 mg | 113 mg | 343 mg | 354 mg | 354 mg |
| Calcium | 15.2 mg | 11.1 mg | 8 mg | 8 mg | 15 mg | 49 mg | 71 mg |
| Iron | 1.1 mg | 0.422 mg | 0.64 mg | 0.7 mg | 1.12 mg | 2.18 mg | 400 mg |
| Fruits‚ vegetables‚ nuts and rapeseed‚ walnut and olive oils | 4.46 % | 7.15 % | 0 % | 0 % | 0 % | 18.4 % | 18.4 % |
| Fruits‚ vegetables‚ nuts and rapeseed‚ walnut and olive oils (manual estimate from ingredients list) | 20.4 % | 10.3 % | 3.1 % | 4 % | 21 % | 36 % | 47 % |
563 products
-
Ravioli pur bœuf sans colorant ni conservateur - Panzani - 400 g

-
Le Ravioli, Pur Bœuf - Panzani - 800 g
-
PZ RAVIOLI BOLO 800GR - Panzani - 800 g
-
Ravioli boeuf - Lustucru - 300 g
-
Le Ravioli Bolognaise sans conservateur - Panzani - 400 g
-
Ravioli pur bœuf - Zapetti - 400 g

-
Ravioli pur boeuf français - Zapetti - 800 g
-
Gyoza poulet - Ajinomoto - 212 g (10 pièces)
-
Ravioli Pur Bœuf - Toque du Chef - 800 g

-
Ravioli - Panzani - 800 g

-
Ravioli Bœuf et Oignons - Turini - 300 g
-
Ravioli Pur Bœuf - Carrefour - 400 g

-
RAVIOLI JAMBON CRU, FIGUES & RICOTTA - Rana - 250 g

-
Ravioli in Tomatensauce mit fleischhaltiger Füllung - Maggi - 800 g

-
Chicken Gyoza Dinner Dumplings - Itsu - 240 g
-
Ravioli bolognaise - Fleury Michon - 300 g
-
Ravioli - Maggi - 1pcs
-
Le Ravioli (Pur Bœuf) - Panzani - 1200 g
-
Beef Ravioli - Heinz - 400 g e
-
Ravioli sauce bolognaise - Zapetti - 400g
-
Ravioli pur bœuf - Carrefour - 650 g
-
Ravioli Bœuf Bio - Jardin bio - 700 g

-
Lustucru ravioli jambon fromage 300g - 300 g
-
Ravioli Bolognaise - Toque du Chef - 800 g
-
Lustucru ravioli boeuf bolognaise 300g - 300 g

-
Zapetti Bio Ravioli pur bœuf - 400 g

-
ravioli pur boeuf - Côté Table - 800 g
-
Raviolis Bolognaise - zapetti - 800g
-
Ravioli pur boeuf - Zapetti - 800 g
-
Ravioli pur boeuf - Marque Repère - 400 g
-
Gyoza poulet legumes - AJINOMOTO - 400 g

-
Ravioli pur boeuf - U - 400 g
-
Ravioli Volaille - Jardin bio logique - 700 g

-
Le Cannelloni (100 % pur Bœuf) - Panzani - 800 g
-
Ravioli jambon - Carrefour - 300 g
-
Gyoza poulet chou et champignons - Mel Asia - 300 g
-
Ravioli pur boeuf - Auchan - 0.4 kg
-
Ravioli pur boeuf - Zapetti - 300g
-
Mini Ravioli - Chef Boyardee - 425 g

-
Ravioli pur boeuf - Leader Price - 800
-
Grandi Girasoli - RANA - 325 g
-
Ravioli bœuf - Fiorini - 300 g

-
Ravioli mit Tomatensoße - La Finesse - 800g
-
RAVIOLI Sauce Bolognaise - Auchan - 0.8 kg
-
Ravioli au bœuf - D'Antelli

-
Ravioli Dose mit Eier - Hero - 430g

-
Ravioli pur boeuf - Auchan - 0.8 kg
-
Ravioli (pur Bœuf) - Fiorini - 800 g

-
Raviolis au jambon - Turini - 300 g
-
Ravioli bolognaise - Côté Table - 400 g
-
Ravioli pur boeuf - Fiorini - 400g
-
Ravioli pur bœuf - Bio Village

-
Ravioli, Pur Bœuf - Carrefour - 800 g
-
8 jirou pao au poulet - Picard - 210 g
-
Ravioli boeuf recette aux oeufs frais - Casino - 300 g

-
Ravioli pur bœuf - Cora - 800 g
-
Ravioli Pur Bœuf, Sauce Italienne - Les Légendaires - 800 g
-
Ravioli Bolognese - Maggi - 800g
-
Ravioli au bœuf braisé - L'italie Des Pâtes - 250 g
-
Ravioli bolognaise - Coté table - 800 g
-
Raviolis au boeuf BIO - Casino Bio - 650 g
-
Ravioli pur bœuf sauce italienne - Dounia Halal - 800 g (2 personnes)
-
Ravioli pur boeuf - fiorini - 650 g

-
Ravioli au Bœuf Bio - 340 g - La Réserve de Champlat

-
Ravioli pur bœuf sauce à l'italienne - Casino - 800 g

-
Zakia ravioli halal boeuf 800g - 800 g
-
Ravioli Pur Bœuf (Sauce Italienne) - Delicato - 400 g
-
Ravioli pur boeuf - Leader Price - 400 g
-
Le ravioli bolognaise - Panzani - 1200 g
-
Ravioli Bio au Blé Complet Boeuf et Petits Légumes - Rana - 250 g

-
Ravioli à la bolognaise - U - 800 g
-
Pâtes fraîches au au bleu du Vercors-Sassenage AOP & baies roses - Saint-Jean - 250 g
-
Rindfleisch-Ravioli - Delicato - 1pcs
-
Ravioli bœuf - U - 300 g
-
Ravioli à la carbonara - Auchan - 0.3 kg
-
Ravioli à la sauce tomate - Dounia Halal - 800 g (2 Pers.)
-
Ravioli Bœuf - Carrefour - 300 g
-
Ravioli sauce tomate - Top budget - 800 g
-
Ravioli pur boeuf - U - 800 g
-
Ravioli au Poulet - Danival - 670 g

-
1 boîte Ravioli plus de boeuf - U
-
Ravioli sauce Bolognaise - Leader Price - 800 g
-
Ravioli Boeuf + - Danival - 840g
-
Ravioli de bœuf - Carrefour - 1200 g

-
Gyoza de pollo y verduras - Ajinomoto - 1,4 kg
-
Ravioli pur boeuf - Mon bon Bio - 300 g
-
Ravioli bolognaise - toque du chef - 400 g
-
Ravioli Bolognaise - Carrefour - 400 g
-
Ravioli bolognaise - 800 g

-
Ravioli Bolognaise - Carrefour - 800 g
-
Ravioli Pur Boeuf - Monoprix
-
Ravioli pur boeuf 7,5% - U - 1,2 kg

-
Ravioli bolognaise - U - 400 g
-
Ravioli au Boeuf Bio - Danival - 670 g

-
Ravioli Pur Bœuf Sauce Italienne - Casino - 400 g

-
Bouchées Vapeur - 3 Hacao Poulet, 3 Funko Crevette, 3 Xiu Mai Crevette, Sauce Soja et Sauce Aigre Douce - Itinéraire des Saveurs - 235 g e
-
30 Gyozas Poulet Et Legumes - Ajinomoto - 600 g

-
Ravioli de bœuf - Preziosi Sapori - 500 g e
-
Ravioli au boeuf - U - 300 g
-
Ravioli pur bœuf - Casa d'Oro - 400 g e
