Nut bars
Belongs to:
Bars, Nuts and their products, Sweet snacks, Snacks, Plant-based foods, Plant-based foods and beverages
Contains:
Nutrition facts
Average nutrition facts for the 516 products of the Nut bars category for which nutrition facts are known (out of 539 products).
| Nutrition facts | As sold for 100 g / 100 ml |
Standard deviation | Minimum | 10th centile | Median | 90th centile | Maximum |
|---|---|---|---|---|---|---|---|
| Energy |
2,000 kj (478 kcal) |
243 kj (57 kcal) |
200 kj (78 kcal) |
1,600 kj (382 kcal) |
2,060 kj (491 kcal) |
2,290 kj (546 kcal) |
3,410 kj (814 kcal) |
| Fat | 28.1 g | 7.66 g | 2.5 g | 13 g | 30 g | 38.1 g | 55.1 g |
| Saturated fat | 5.48 g | 2.38 g | 0 g | 2.1 g | 5.1 g | 10 g | 25 g |
| Monounsaturated fat | 13.5 g | 5.32 g | 2.92 g | 5.15 g | 14.1 g | 22.1 g | 22.5 g |
| Polyunsaturated fat | 8.28 g | 4.78 g | 0 g | 2.27 g | 7.86 g | 17 g | 18.7 g |
| Trans fat | 0 g | 0 g | 0 g | 0 g | 0 g | 0 g | 0 g |
| Cholesterol | 0 mg | 0 mg | 0 mg | 0 mg | 0 mg | 0 mg | 0 mg |
| Carbohydrates | 40.5 g | 10.3 g | 7.2 g | 24 g | 40 g | 58 g | 79.2 g |
| Sugars | 24.6 g | 9.35 g | 0 g | 12 g | 24 g | 39.8 g | 71.9 g |
| Added sugars | 15.3 g | 10.9 g | 0 g | 0 g | 10 g | 53.6 g | 53.6 g |
| Fiber | 8.18 g | 3.7 g | 0 g | 3.6 g | 7.1 g | 15.8 g | 78 g |
| Proteins | 14.3 g | 4.52 g | 0 g | 7.4 g | 14 g | 22.6 g | 49 g |
| Salt | 0.298 g | 0.294 g | 0 g | 0.01 g | 0.2 g | 0.875 g | 28.6 g |
| Alcohol | 0 % vol | 0 % vol | 0 % vol | 0 % vol | 0 % vol | 0 % vol | 0 % vol |
| Vitamin A | 4.41 µg | 17.6 µg | 0 µg | 0 µg | 0 µg | 75 µg | 125 µg |
| Vitamin C (ascorbic acid) | 0 mg | 0 mg | 0 mg | 0 mg | 0 mg | 0 mg | 1.2 mg |
| Potassium | 429 mg | 193 mg | 10 mg | 200 mg | 375 mg | 857 mg | 1,310 mg |
| Calcium | 85.4 mg | 65.2 mg | 0 mg | 0 mg | 100 mg | 200 mg | 1,280 mg |
| Iron | 3.06 mg | 1.8 mg | 0 mg | 1.03 mg | 2.7 mg | 7.2 mg | 3,560 mg |
| Fruits‚ vegetables‚ nuts and rapeseed‚ walnut and olive oils | 72.7 % | 33.6 % | 1 % | 1 % | 93 % | 100 % | 100 % |
| Fruits‚ vegetables‚ nuts and rapeseed‚ walnut and olive oils (manual estimate from ingredients list) | 54.6 % | 24.1 % | 16.2 % | 22 % | 59 % | 100 % | 100 % |
539 products
-
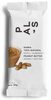
Pals 18 pack cafe - Pals snacks barra sabor cafe - 50 g
-
Pals barra cafe - Pals snacks barra sabor cafe - 50 g

-
Pals 6 pack arandano - Pals snacks barra sabor arandano - 50 g

-
Pals 6 pack crema de cacahuate - Pals snacks barra sabor cacahuate - 50 g

-
Pals 18 pack arandano - Pals snacks barra sabor arandano - 50 g

-
Pals 18 pack chocolate - Pals snacks barra sabor chocolate - 50 g
-
Pals 18 pack crema de cacahuate - Pals snacks barra sabor cacahuate - 50 g
-
Pals barra crema de cacahuate - Pals snacks barra sabor cacahuate - 50 g
-
Pals 18 pack coco - Pals snacks barra sabor coco - 50 g
-
KIND - 40g
-
Cashew & Cranberry trail mix bar
-
High Protein Nut Bar with Strawberries and Raspberries - Jannis - 3x28g

-
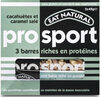
Prosport - barre cacahuètes 🥜et caramel salé - Eat Natural - 3 x 45 g
-
Pals 6 pack chocolate - Pals snacks barra sabor chocolate - 50 g
-
Pals barra arandano - Pals snacks barra sabor arandano - 50 g
-
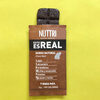
Nuttri Barra Super Snacks - 14g
-
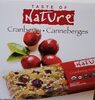
Taste of Nature Quebec Cranberry Carnival
-
Barra Manzana y Chía - Zafan - 28 g
-
Pals barra coco - Pals snacks barra sabor coco - 50 g
-
Pals 6 pack coco - Pals snacks barra sabor coco - 50 g
-
Natura barrita - Borges - 25 g
-
Roasted almond trail mix bar - Deliciously Ella

-
Barres aux fruits secs - Eat Natural - (3 x 50g)
-
Cranberry nut - Bazzini Llc
-
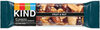
Almond Cashew Omega- 3 Plus Bar - Kind
-
Krokant Riegel, Erdnuss Kürbiskern Cranberry - Dm bio
-
foodlose - 35g
-
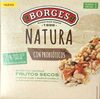
Natura con Probióticos Frutos Secos - Borges - 90 g (3 x 30 g)
-
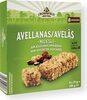
Barritas avellanas - Crownfield - 200 g (8 x 25 g)
-
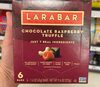
Chocolate Raspberry Truffle Bar - LaraBar
-
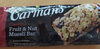
Classic Fruit and Nut Muesli Bar - Carman's - 45 g
-
Natura con Probióticos Frutos Secos - Borges - 30 g
-
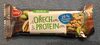
Arašídová tyčinka se sójovým proteinem a arašídy - Emco - 35 g
-
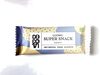
Luomu super snack cashew - Cocovi - 30g
-
KERUAK CACAO - The Food Beat - 50g

-
Noisette, graine de courge et abricot, 3 barres - MONOPRIX BIO ! - 75 g

-
Fruit et nut - Nature Valley - 120 g

-
Natural bars - Knusperone - 5 x 35 g
-
Barritas Espirulina Y Limon - Lubs

-
Vital - Bimbo - 30 g
-
Pure & Simple Bar - Elevation - 8 oz
-
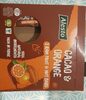
Organic Brazil Nut Orange Fruit and Nut Bar - Madegood - 36 g
-
Vanilla Berries - Raw-Bite - 50g
-
The Organic Fruit & Nut Bite Apple Cinnamon - Raw-Bite - 50 g

-
Cashew dattel riegel - Knusperone - 175 g
-
Mixitka kawowa - Batonik daktylowy z kawą i orzechami nerkowca - mix.it - 50 g

-
Barrita chocolate proteína - Hero
-
Protein - Raw-Bite - 50 g
-
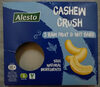
Cashew Crush - Alesto - 175 g
-
Nakd - 35 g

-
Berry Delight Bars - Nakd - 3 x 35 g

-
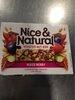
Nice & Natural - Mixed Berry - 192 g
-
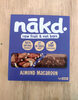
Almond Macaroon - Nakd - 4 x 35g
-
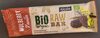
Bio Raw Bar Maulbeere-Vanille - Alesto - 30g
-
Snack Bites Kakao Walnuss - lycka - 55 g

-
Getraw Licorice & Almond Bar - 42 g

-
Barre de figues aux amandes - Les plaisirs fruités
-
Raw-Bite Cacao - 50 g
-
Raw Fruit & Nut Bars - Blueberry Muffin - nākd - 4 x 35 g

-
Barre bjorg pommes noix - 30 g
-
Cashew - Raw-Bite - 50 g

-
Wholistic Peanut Dark Chocolate & Sea Salt - 40g

-
nākd - 35 g

-
Cocoa Orange Fruit & Nut Bars - Nakd - 35 g x 4

-
Blueberry, Vanilla & Cashew Bar - Kind - 1.4 oz

-
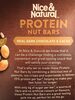
Protein nut bars - Nice & Natural - 165 g
-
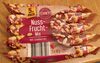
Nuss Frucht Mix mit Cranberries - Clarkys - 5 x 40 g
-
Nut bars - Great Value

-
Superfoodriegel Kakao & Kakonibs - enerBio - 40g
-
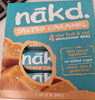
Raw Fruit & Nut Bars - Salted Caramel - nākd - 4 x 35 g
-
Cacao and orange 5 raw fruit and nut bars - Lidl
-
Pressed fruit & nut bar - Marks & Spencer
-
Peanut Delight - Nakd - 4 x 35 g
-
Coffee & Walnut Fruit & Nut Bars 4 x - Nakd
-
Cashew butter chocolate chip - Wegmans Organic
-
Nakd Peanut Delight raw fruit & peanut wholefood bar
-
Raw Fruit & Nut Bars - Bakewell Tart - nākd - 4 x 35g
-
Gourmie's La Vie En Rose Gourmie's - 35 g
-
Cashew crush raw fruit and nut bar - alesto - 35g
-
Delhi Delight Bio-Nussriegel - foodloose - 35g
-
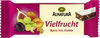
Riegel - Vielfrucht - Alnatura - 40 g
-
Cashew Cookie Fruit & Nut Bar - nakd - 35 g
-
Peanut delight - Nākd - 35g

-
Premium Nut Bars

-
Barrita de frutos secos - Carrefour sensation

-
Roasted nutbar almond, hazelnut & vanilla - Carman's - 350 g

-
Nuts & Sea Salt with Dark Chocolate Nut Bar - Only - 5.6 oz

-
Bakewell Tart - Raw Fruit & Nut Bar - Alesto - 35 g

-
Almond protein bar
-
NUTS & BERRIES - Euras Int. - 40 g

-
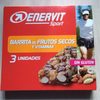
Barrita de frutos secos con vitaminas - Enervit Sport
-
Prenium Nut Bars Almond Hazelnut & Vanilla - hillcrest - 5 pack 175g
-
Protein nut bars - Dark chocolate and sea salt - Trek - 3 x 40 g
-
Peanut Butter Jelly & Oats Bob's Bar - Bob's Red Mill - 12 x 1.76 oz
-
Tru. - aldi - 1

-
Super Fruit Bar Mango - BioTechUSA - 30 g
-
Nut bar - Hema - 75 g
-
Farmer Nuts amande figue - Migros
-
Protein Puck - - 92 g
-
Barre cacahuètes amandes cranberry - Kanna'Bar - 35 g