Pancake mixes - Page 3
Belongs to:
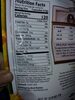
Nutrition facts
Average nutrition facts for the 496 products of the Pancake mixes category for which nutrition facts are known (out of 537 products).
| Nutrition facts | As sold for 100 g / 100 ml |
Standard deviation | Minimum | 10th centile | Median | 90th centile | Maximum |
|---|---|---|---|---|---|---|---|
| Energy |
1,420 kj (339 kcal) |
218 kj (51 kcal) |
18 kj (4 kcal) |
837 kj (194 kcal) |
1,470 kj (352 kcal) |
1,620 kj (386 kcal) |
3,590 kj (859 kcal) |
| Fat | 3.53 g | 2.57 g | 0 g | 0 g | 3.2 g | 8.18 g | 45 g |
| Saturated fat | 0.764 g | 1.01 g | 0 g | 0 g | 0.2 g | 3 g | 22 g |
| Monounsaturated fat | 0.76 g | 0.643 g | 0 g | 0 g | 0.82 g | 1.64 g | 1.82 g |
| Polyunsaturated fat | 0.623 g | 0.414 g | 0 g | 0 g | 0.82 g | 1.11 g | 1.75 g |
| Trans fat | 0 g | 0 g | 0 g | 0 g | 0 g | 0 g | 1.11 g |
| Cholesterol | 5.9 mg | 9.78 mg | 0 mg | 0 mg | 0 mg | 25 mg | 286 mg |
| Carbohydrates | 62.5 g | 15.2 g | 0 g | 30 g | 70 g | 76.3 g | 122 g |
| Sugars | 10.2 g | 5.52 g | 0 g | 2 g | 10 g | 19.4 g | 50 g |
| Added sugars | 10.8 g | 5.22 g | 0 g | 4.88 g | 11.4 g | 20 g | 21.5 g |
| Fiber | 3.73 g | 2.55 g | 0 g | 1.4 g | 2.6 g | 9.3 g | 26 g |
| Proteins | 10.4 g | 5.57 g | 0 g | 5 g | 9.09 g | 23.8 g | 72 g |
| Salt | 2.02 g | 0.817 g | 0 g | 0.533 g | 2.11 g | 3.21 g | 2,050 g |
| Vitamin A | 0.436 µg | 4.7 µg | 0 µg | 0 µg | 0 µg | 0 µg | 2,050 µg |
| Vitamin D | 0.243 µg | 0.593 µg | 0 µg | 0 µg | 0 µg | 1.89 µg | 14 µg |
| Vitamin C (ascorbic acid) | 0.2 mg | 0.819 mg | 0 mg | 0 mg | 0 mg | 2.6 mg | 37.5 mg |
| Vitamin B1 (Thiamin) | 4.36 mg | 21.9 mg | 0 mg | 0 mg | 0 mg | 5 mg | 900 mg |
| Vitamin B2 (Riboflavin) | 6.34 mg | 33.9 mg | 0 mg | 0.217 mg | 0.34 mg | 4.18 mg | 447 mg |
| Vitamin B3/PP (Niacin) | 3.54 mg | 1.07 mg | 0 mg | 1.8 mg | 3.56 mg | 5.13 mg | 14.2 mg |
| Vitamin B9 (Folic acid) | 67.7 µg | 27.5 µg | 34 µg | 38 µg | 61 µg | 124 µg | 128 µg |
| Potassium | 165 mg | 105 mg | 0 mg | 0.333 mg | 119 mg | 358 mg | 1,120 mg |
| Calcium | 203 mg | 115 mg | 0 mg | 50 mg | 190 mg | 418 mg | 784 mg |
| Phosphorus | 503 mg | 160 mg | 0 mg | 200 mg | 574 mg | 653 mg | 1,050 mg |
| Iron | 3 mg | 1.06 mg | 0 mg | 1.14 mg | 3.05 mg | 4.5 mg | 1,590 mg |
536 products
-
High-protein pancake & waffle mix - Wholesome Chow - 14 servings
-
Pancakes - BetterBaking - 100g
-
Blueberry complete pancake & waffle mix, blueberry - Food Club

-
Paleo Pancake & Waffle Mix - Birch Benders - 42 oz
-
Pancake shake buttermilk - White Mill - 375g
-
Hungry Jack Buttermilk Pancake and Waffle Mix
-
Protein pancake & baking mix, banana hazelnut - Flap Jacked
-
Blueberry - Pancake & Waffle mix
-
Pancakes & Waffles de Avena NATURAL - El Molino Criollo - 340 g
-
Power Cakes - Kodiak Cames - 567g
-
Haz de Oros Mezcla Lista para Pancakes Crepes y Waffles Avena - Harinera del Valle - 300 g

-
Stonewall kitchen, pancake & waffle mix, cinnamon apple
-
Complete Pancake & Waffle Mix - Hy-Vee Inc.
-
Pancake mix butter milk - 430 g
-
Pancake Mix - Trader Joe's

-
Complete Pancake & Waffle Mix - That's Smart!
-
Kimchi Pancake Mix - Ottogi - 320g
-
Eierpfannkuchen - Ruf - 200g
-
Pancake prozis

-
Pannekaker familiepakning - Toro - 522g
-
Pancake & Waffle Mix - Birch Benders
-
Limoncello Inspired Blueberry Pancake Mix - Giant
-
Complete pancake mix - Krusteaz - 793 g
-
Original Pancake & Waffle Mix by LIDL - 32 oz
-
Maizena Biscochuelo de chocolate con semillas - 500g
-
Pannenkoekmix glutenvrij - Albert Heijn
-
Blueberry pancake & waffle mix - Stonewall Kitchen - 453g
-
Pancake & Waffle Mix - Great Value - 28 oz
-
Pancake meal - Body&fit

-
Pancake - Daily Life - 500g

-
Pancake & waffle mix - Arrowhead Mills

-
Strawberry Chocolate Chip pancake and waffle mix - Kodak Cakes - 17 oz
-
Smart Protein Pancakes - Banana-Caramel - Body&Fit - 400gr
-
Original pancake and waffle mix - Kroger - 32 oz
-
Extra Light & Fluffy Pancake and Waffle Mix - Hungry Jacks - 907g
-
Mix voor pannenkoeken volkoren - Koopmans - 400 g
-
Sugar free pancake & waffle mix - Maple Grove Farms Of Vermont
-
Zero Instant Pancake - Prozis - 900 g

-
Old fashioned pancake & waffle mix, old fashioned - Snoqualmie Falls Lodge
-
Super mix gouter - Naturaline
-
Complete Pancake & Waffle Mix - Great Value - 928g

-
Buttermilk Pancake Mix - The Pancake Parlour - 500g

-
Buttermilk Pancake Mix - Wegmans - 32 oz

-
Buttermilk Pancake Mix - Fast Shake
-
The original pancake & waffle mix pound box - Aunt Jemima
-
Funfetti Buttermilk Pancake & Waffle Mix - Pillsbury - 28 oz
-
Complete Pancake & Waffle Mix - Safeway Inc.
-
Buttermilk Pancake & Waffle Complete Mix, Buttermilk - Shoprite
-
Blueberry - Meijer
-
Gluten Free Keto Pancake Mix - King Arthur - 12 oz
-
Protéine pancake mix original - Bulk - 500 g
-
Collagen Grain-Free Protein Pancake Mix - Purely Elizabeth - 10 oz
-
Funfetti Pancake Mix - Pillsbury

-
Grain-Free Pancake + Waffle Mix - Purely Elizabeth - 10 oz
-
Protein pancake neutral - Fit4Day - 50 g
-
Gluten free dreams pancake & waffle mix - Cherrybrook Kitchen - 18 oz
-
Kaiserschmarrn mit Rosinen - Grandiso

-
Organic Pancake & Waffle Mix - Birch Benders
-
Préparation pour Crêpes - Farinelle - 1 kg
-
Paleo Pancake & Waffle Mix - Birch Benders
-
Pancake & Waffle Mix - Birch Benders
-
Organic Confetti Pancake & Waffle Mix - Birch Benders - 14 oz
-
Whole Grain Pancake and Waffle Mix - PC Blue Menu - 905 g
-
Organic Buttermilk Pancake & Waffle Mix - Birch Benders - 16 oz
-
Biscuit Mix - Tova Industries llc - 8 oz
-
Whole Wheat Pancake Mix - Tova Farms - 8 oz
-
Protein Pancake Mix - Krusteaz - 72 oz
-
Classic Recipe Pancake & Waffle Mix - Birch Benders - 56 oz
-
Gluten free pancake mix - Bob's Red Mill - 623 g
-
Bisquick Original Pancake and Baking Mix - Betty Crocker - 6 pounds
-
Pancake & Waffle Mix - Birch Benders
-
Buttermilk Pancake Mix - C.H. Guenther and Son - 1.6 lbs
-
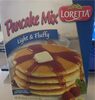
Light & fluffy pancake mix - Loretta - 16.5 OZ
-
Buttermilk Pancake Mix - Edmonds - 325 g
-
Pancake premium mix - Duinkerken - 440 g
-
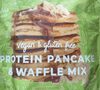
Protein Pancake & Waffle Mix
-
Organic pancake & waffle mix - Arrowhead Mills
-
Original pancake mix - coles - 350g
-
Pancake & waffle mix - Natures Promise - 15 oz
-
Pancake mix -
-
Unicorn Funfetti Buttermilk Pancake & Waffle Mix - Pillsbury - 28 oz

-
Pancake mix

-
Pancake mix
-
Pannenkoek mix - Ekoplaza - 500 g
-
meergranen pannenkoeken mix koopmans
-
High protein pancake mix - PY - 250 g
-
Pannenkoekenmix - Boerenbont - 500 g
-
Pancake & Waffle Mix - H-E-B
-
Pancake & Waffle Mix - H-E-B
-
Buttermilk complete pancake & waffle mix - Mrs. Butterworth's - 32 oz
-
Pancake waffle mix - 340 g
-
Organic Pancake & Waffle Mix, Buttermilk - 365 Everyday Value - 32 oz
-
Mix for pancakes - AH BASIC - 200 g
-
Complete buttermilk pancake & waffle mix - Kroger - 32 oz
-
Complete pancake mix - Target Brands Inc. - 32 oz
-
Pancake & Piklet mix - Coles

-
Blueberry acai pancake mix - Hawaiian Sun - 6 oz
-
Cinnamon Oat Protein Pancake Mix - Wholesome Pantry - 18 oz
-
Buttermilk Pancake mix
-
Vegan pancake shaker - M&S - 155g
