Pasta sauces - Page 32
Belongs to:
Contains:
Nutrition facts
Average nutrition facts for the 2949 products of the Pasta sauces category for which nutrition facts are known (out of 3156 products).
| Nutrition facts | As sold for 100 g / 100 ml |
Standard deviation | Minimum | 10th centile | Median | 90th centile | Maximum |
|---|---|---|---|---|---|---|---|
| Energy |
470 kj (112 kcal) |
375 kj (89 kcal) |
0 kj (0 kcal) |
184 kj (44 kcal) |
334 kj (80 kcal) |
1,400 kj (335 kcal) |
4,300 kj (1030 kcal) |
| Energy from fat |
110 kj (26 kcal) |
80 kj (19 kcal) |
0 kj (0 kcal) |
33.6 kj (8 kcal) |
134 kj (32 kcal) |
251 kj (60 kcal) |
502 kj (120 kcal) |
| Fat | 7.11 g | 9 g | 0 g | 0.8 g | 3.85 g | 30 g | 100 g |
| Saturated fat | 1.43 g | 1.74 g | 0 g | 0 g | 0.8 g | 5.3 g | 25 g |
| Monounsaturated fat | 0.717 g | 0.727 g | 0 g | 0 g | 0.4 g | 2.69 g | 4 g |
| Polyunsaturated fat | 0.467 g | 0.394 g | 0 g | 0 g | 0.42 g | 1.17 g | 1.2 g |
| Trans fat | 0 g | 0 g | 0 g | 0 g | 0 g | 0 g | 0.81 g |
| Cholesterol | 2.45 mg | 6.88 mg | 0 mg | 0 mg | 0 mg | 16 mg | 188 mg |
| Carbohydrates | 6.95 g | 2.08 g | 0 g | 3.9 g | 6.8 g | 10.5 g | 80 g |
| Sugars | 4.54 g | 1.65 g | 0 g | 1.64 g | 4.7 g | 7.1 g | 63 g |
| Added sugars | 0.871 g | 1 g | 0 g | 0 g | 0.8 g | 2.4 g | 2.4 g |
| Fiber | 1.58 g | 0.682 g | 0 g | 0.5 g | 1.6 g | 2.7 g | 21 g |
| Proteins | 2.86 g | 1.75 g | 0 g | 1.1 g | 2 g | 6.2 g | 73.8 g |
| Salt | 1.15 g | 0.452 g | 0 g | 0.6 g | 1.03 g | 2.1 g | 758 g |
| Alcohol | 0 % vol | 0 % vol | 0 % vol | 0 % vol | 0 % vol | 0 % vol | 2 % vol |
| Vitamin A | 156 µg | 78.9 µg | 0 µg | 57.6 µg | 120 µg | 305 µg | 1,500 µg |
| Vitamin D | 0.007 µg | 0.022 µg | 0 µg | 0 µg | 0 µg | 0.081 µg | 0.825 µg |
| Vitamin C (ascorbic acid) | 5.45 mg | 4.76 mg | 0 mg | 0 mg | 4.7 mg | 14.4 mg | 34,300 mg |
| Potassium | 288 mg | 81 mg | 0.053 mg | 178 mg | 297 mg | 427 mg | 8,000 mg |
| Calcium | 30.1 mg | 19 mg | 0 mg | 16 mg | 24 mg | 67 mg | 400 mg |
| Iron | 0.731 mg | 0.349 mg | 0 mg | 0.14 mg | 0.67 mg | 1.27 mg | 12 mg |
| Fruits‚ vegetables‚ nuts and rapeseed‚ walnut and olive oils | 54.8 % | 23.9 % | 0 % | 10.2 % | 52 % | 87.7 % | 98.7 % |
| Fruits‚ vegetables‚ nuts and rapeseed‚ walnut and olive oils (manual estimate from ingredients list) | 74.3 % | 17 % | 30 % | 48 % | 80 % | 93.5 % | 95 % |
3,154 products
-
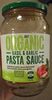
Organic Basil & Garlic Pasta sauce
-
Organic Traditional Pasta Sauce -

-
Pasta Sauce - REWE Beste Wahl - 200g/192ml
-
Bolognese Pasta Sauce - Fresh & Easy

-
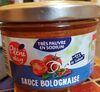
Sauce Bolognaise Italienne Care Free
-
Arrabbiata - Il Boschetto Maremma Toscana S.R.L.
-
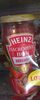
Arrabiata - Heinz
-
Mom's, Garlic Marinara Pasta Sauce, Garlic Marinara - Mom's Spaghetti Sauce Company
-
Spaghetti Sauce - Casa Visco
-
Spaghetti Sauce Mix With Mushrooms - Kroger
-
Spaghetti Sauce Mix - Simply Organic
-
Spaghetti Sauce Sweet Filipino Style
-
Spaghetti in Tomato Sauce - - 400g
-
Spaghetti Thick N' Zesty Sauce Mix - Chef Swagger's Kitchen
-
Traditional Spaghetti Sauce Mix - Durkee
-
Thick & Zesty Spaghetti Sauce Mix - Kroger
-
Italian Herb Spaghetti Sauce Mix - Simply Organic
-
Italian Sauce Mix, Spaghetti - French's
-
Alfredo Sauce - Victoria Fine Foods
-
Alfredo Pasta Sauce - Mario Batali
-
Alfredo Fettuccini Pasta & Sauce - Spartan
-
Alfredo Fresh Sauce - Haggen
-
Pasta Sauce - Mario Batali
-
Pasta Sauce
-
Pasta Sauce - Lowes Foods
-
Pasta Sauce - Meijer Gold
-
Pasta Sauce - Natural Directions
-
Pasta Sauce - Pasta On The Side
-
Pasta Sauce - Red Gold
-
Pure Tomato Pasta Sauce - Borgo De' Medici
-
Pasta Sauce, Tomato Basil - Simple Truth Organic
-
Pasta Sauce, Tomato Basil - Shoprite
-
Premium Tomato Basil Pasta Sauce - La Vorato's
-
Sauce bolognaise
-
Sauce Pour Pâte - Miracoli
-
Sauce bolognaise
-
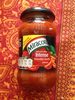
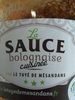
Sauce bolognaise - Le Tuye De Mesandans - 450g
-
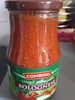
Tomatensauce Bolognese - Combino - 400 ml
-
Cannizzaro, Arrabbiata Sauce - Cannizzaro Famiglia Llc
-
Pasta Sauce, Authenitc Italian Arrabbiata - Delhaize America Inc.
-
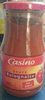
Sauce Bolognaise - Casino - 420 g
-
Sauce a La Bolognaise
-
Sauce Bolognaise Bien Vu,l
-
Sauce Bolognaise
-
Sauce bolognaise - Delicato
-
Pasta Sauce - Racconto Riserva
-
Sauce bolognaise - Panzani
-
bolognaise - zapetti
-
Sauce pates - Heinz
-
Vodka Pasta Sauce - World Market - 680 g
-
Vodka Cream Pasta Sauce - Fresh & Easy
-
Premium Pasta Sauce, Vodka Cream - La Vorato's
-
Sauce Carbonara - Anna's Best - 200 ml
-
Sauce carbonara -
-
Carbonara Pasta Sauce - World Market
-
Pasta Sauce Arrabiata - K classic
-
Sauce bolognaise - Reynaud De Pernes

-
Tomato & Basil Pasta Sauce - Barilla - 24 oz (680 g)

-
Maggi Spaghetti Bolognese - 1 kg
