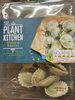
Pasta stuffed with vegetables
Nutrition facts
Average nutrition facts for the 309 products of the Pasta stuffed with vegetables category for which nutrition facts are known (out of 322 products).
| Nutrition facts | As sold for 100 g / 100 ml |
Standard deviation | Minimum | 10th centile | Median | 90th centile | Maximum |
|---|---|---|---|---|---|---|---|
| Energy |
827 kj (201 kcal) |
293 kj (69 kcal) |
259 kj (62 kcal) |
348 kj (83 kcal) |
925 kj (224 kcal) |
1,190 kj (286 kcal) |
1,900 kj (455 kcal) |
| Fat | 5.66 g | 2.8 g | 0.7 g | 1.7 g | 5.6 g | 10.3 g | 20 g |
| Saturated fat | 1.91 g | 1.46 g | 0 g | 0.2 g | 1.8 g | 4.8 g | 8.57 g |
| Carbohydrates | 27.9 g | 9.89 g | 9.4 g | 12 g | 30 g | 41.3 g | 59 g |
| Sugars | 2.89 g | 1.31 g | 0 g | 1 g | 2.8 g | 5.5 g | 45.7 g |
| Fiber | 2.61 g | 1.14 g | 0 g | 1.2 g | 2.3 g | 5.2 g | 17 g |
| Proteins | 6.97 g | 2.91 g | 0.9 g | 2.3 g | 8 g | 11 g | 15.9 g |
| Salt | 0.987 g | 0.257 g | 0 g | 0.588 g | 1 g | 1.4 g | 3.3 g |
| Fruits‚ vegetables‚ nuts and rapeseed‚ walnut and olive oils (manual estimate from ingredients list) | 18.8 % | 6.05 % | 5.6 % | 7.4 % | 17.9 % | 38.8 % | 50 % |
321 products
-
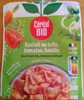
Ravioli au tofu, tomates, basilic - Céréal Bio - 267 g
-
Raviolis végétariens - Toque du Chef - 650 g
-
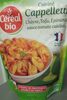
Cuisiné cappelletti - Céréal Bio - 220 g
-
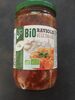
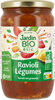
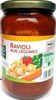
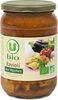
Pâtes farcies aux légumes à la sauce tomate bio - Jardin bio - 675 g
-
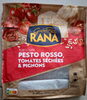
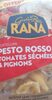
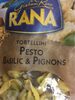
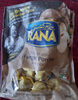
Tortellini Pesto Rosso, Tomates Séchées & Pignons - Giovanni Rana - 250 g
-
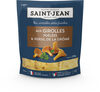
Ravioli aux girolles poêlées & persil de la Drôme sachet - Saint jean - 250 g
-
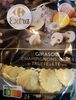
Girasoli potiron & petits oignons grillés - Rana Giovanni Rana - 250 g

-
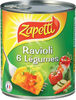
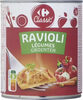
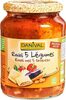
Ravioli 6 légumes - Zapetti - 800 g
-
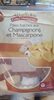
Pâtes fraîches champignons et mascarpone - Casa morando - 250 g
-
Ravioli vegetariens - Carrefour Bio - 650 g
-
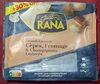
Tortellini ricotta & épinards - Giovanni Rana - 325 g

-
Ravioli tomates rôties et burrata - Voltan - 250 g
-
Girasoli cèpes parmesan - Lustucru - 250 g

-
Spinach Ricotta Tortelloni - Sainsbury's
-
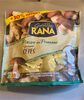
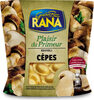
Plaisir du primeur - Rana - 250 g
-
Tortellini - Pesto Rosso, tomates séchées et pignons - Rana - 325g
-
Girasoli cèpes - Rana - 250 g

-
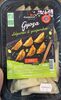
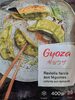
Gyoza - Coquelicot - 200g
-
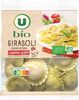
Girasoli légumes grillés - U Bio - 250 g
-
Ravioli de légumes - Jardin bio - 250 g
-
Vemondo - 250

-
Girasoli Tomate Mozzarella Basilic - Lustucru - 260 g

-
Ravioli aux Cèpes, sauce au Parmigiano Reggiano - Picard - 300 g

-
Raviolis aux légumes BIO 675g (bocal) - Fiorini - 675 g

-
Ravioli épinard et ricotta - Jardin Bio Etic - 250 g

-
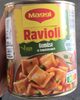
Ravioli Gemüse - Maggi - 800g
-
Ravioli aux légumes bio - Bio Village - 700 g
-
Ravioli Épinards Ricotta - Carrefour Bio - 250 g

-
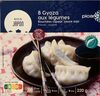
8 Gyoza aux légumes - Picard - 220 g
-
Gyoza Légumes - Ajinomoto - 212 g

-
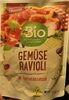
Gemüse Ravioli - dmBio - 270 g
-
Casonsèi - Lidl
-
Ravioli Tofu Tomates et Basilic - Soy - 267 g
-
Raviolis aux 6 Légumes - Côté Table - 800g

-
Ravioli champignons à la crème - Léa Nature Jardin Bio - 250 g
-
De la huerta crema de calabaza y cebolla caramelizada - Giovanni Rana - 250 g
-
Ravioli champignons ail des ours BIO - Comptoir du Pastier - 250 g

-
Girasoli champignons, cèpes et truffe d été - Carrefour - 250 g
-
Grandi Girasoli - RANA - 325 g
-
Ravioli légumes - Carrefour - 400 g

-
Girasoli aux Légumes du Soleil - Rana - 325g

-
Ravioli a la courge butternut - Picard - 300 g e
-
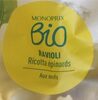
Ravioli Ricotta épinards - Monoprix bio - 250 g
-
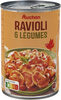
Ravioli 6 Légumes - Auchan - 0.8 kg

-
Spinach Ravioli - Marks & Spencer plant kitchen spinach ravioli - 250g
-
Ravioles - Diamanti
-
Ravioli légumes - Biocoop - 650 g
-
Raviolis vietnamiens aux légumes - Picard - 220 g
-
Gorasoli cepes - Giovanni Rana

-
Ravioli aux Truffes de Toscane - Issimo - 250 g

-
Raviolis aux légumes - U - 650 g
-
Ravioli légumes - Carrefour - 800 g
-
Ravioli légumes Veggie - Bjorg - 670 g

-
Plaisir du Primeur Girasoli Cepes - Rana - 325 g
-
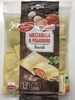
Ravioli mozzarella et tomate - Anna's Best Migros - 250 g
-
Lunette - Lidl - 250 g
-
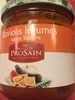
Ravioli Légumes sauce Toscane - ProSain - 680 g
-
Ravioli végétariens - MONOPRIX BIO ! - 650 g
-
Ravioli vegetariens bio - Casino Bio - 650 g
-
Espinacas Brocolis y aceitunas - Hacendado - 250g

-
RAVIOLI RICOTTA EPINARDS MASCARPONE - Giovanni rana - 250 g

-
gyoza - - 400 g
-
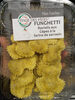
Funghetti raviolis aux cèpes à la farine de sarrasin - L'Italie des Pâtes - 250 g
-
Ravioli 6 légumes - Auchan - 0.4 kg
-
RAVIOLI CEPES - Giovanni Rana - 250 g e
-
Grand ravioli cèpes - Giovanni Rana - 250 g

-
Setas con boletus - Bel Canto - 250 g

-
RAVIOLI LEGUMES DU SOLEIL - Giovanni Rana - 250 g

-
Tortelloni ricotta-épinards - Pasta Nuova - 250 g
-
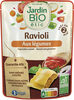
Ravioli aux légumes - Danival - 670 g
-
Ravioli legumes sauce aubergines et herbes - Danival

-
Ravioli légumes du soleil bio - Fiorini - 250 g
-
Ravioli ricotta et épinards - Migros - 250 g
-
Tortelloni ricotta et épinards bio - Treo - 250 g

-
Saccottini pomodoro e mozzarella - Coop - 250 g
-
RAVIOLI aux Légumes Sauce Tomate Olive - Casino - 800 g
-
Gemüse spätzli - Coop - 300g
-
Ravioli végétarien - Valbio - 1 kg

-
Sabores nuestros con setas del bosque - Gallo - 250 g
-
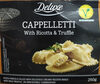
Cappelletti Ricotta et truffe d'été - Deluxe - 250 g
-
Les pâtes farcies vegan - patate douce & pois chiche - Tartex - 250 g
-
Raviolis légumes sauce Toscane - Prosain - 365 g
-
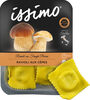
Ravioli aux Cèpes - ISSIMO
-
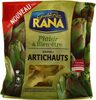
Ravioli Artichauts - Giovanni Rana - 250 g
-
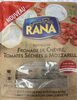
Tortellini Fromage de Chèvre, Tomates Séchées et Mozzarella - Giovanni Rana - 250 g
-
Tortellini Pesto basilic pignons - RANA - 250g
-
Pâtes farcies vegan - Tartex - 250 g

-
Grand Ravioli Tomates et Mozzarella aux Olives Concassées - Giovanni Rana - 250 g

-
Ravioli aux cèpes - Monoprix Bio - j..k.

-
Ravioli aux légumes du soleil - Comme j'aime - 300 g

-
Ravioli légumes du soleil bio - Auchan - 0.25 kg
-
Ravioli Funghi Porcini mit Steinpilzen - Rana - 250 g
-
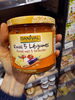
Ravioli 5 légumes - Danival - 360g
-
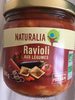
Ravioli aux légumes - Naturalia - 365g
-
Ravioli aux aubergines - La Vie Claire - 250 g

-
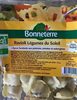
Ravioli legumes du soleil - Bonneterre - 250g
-
Raviolis aux légumes - Naturalia - 1kg
-
Cappelletti Räuchertofu - Vantastic Foods - 250 g
-
Rotolini ricotta e spinaci - Picard - 300 g

-
Mezzelune pomodori marinati e mozzarella di latte di bufala - Auchan - 0.25 kg
