Prepared salads
Belongs to:
Contains:
Nutrition facts
Average nutrition facts for the 5872 products of the Prepared salads category for which nutrition facts are known (out of 6249 products).
| Nutrition facts | As sold for 100 g / 100 ml |
Standard deviation | Minimum | 10th centile | Median | 90th centile | Maximum |
|---|---|---|---|---|---|---|---|
| Energy |
665 kj (160 kcal) |
239 kj (58 kcal) |
0 kj (0 kcal) |
305 kj (73 kcal) |
651 kj (156 kcal) |
1,100 kj (268 kcal) |
3,500 kj (836 kcal) |
| Fat | 9.66 g | 5.46 g | 0 g | 2.14 g | 8.8 g | 20 g | 72.2 g |
| Saturated fat | 1.47 g | 1 g | 0 g | 0.2 g | 1.2 g | 3.5 g | 22 g |
| Monounsaturated fat | 3.26 g | 2.57 g | 0 g | 0 g | 3.08 g | 8.81 g | 12 g |
| Polyunsaturated fat | 2.39 g | 1.87 g | 0 g | 0 g | 2.2 g | 6.06 g | 19.4 g |
| Trans fat | 0 g | 0 g | 0 g | 0 g | 0 g | 0 g | 1.88 g |
| Cholesterol | 16.7 mg | 16.7 mg | 0 mg | 0 mg | 11 mg | 50 mg | 300 mg |
| Carbohydrates | 10.7 g | 5.08 g | 0 g | 3.2 g | 10 g | 19.4 g | 82.5 g |
| Sugars | 3.09 g | 2.01 g | 0 g | 0.8 g | 2.5 g | 7 g | 65 g |
| Fiber | 1.81 g | 0.917 g | 0 g | 0.5 g | 1.7 g | 3.6 g | 40 g |
| Proteins | 4.99 g | 2.62 g | 0 g | 1.2 g | 4.8 g | 9.5 g | 78 g |
| Salt | 0.92 g | 0.346 g | 0 g | 0.4 g | 0.9 g | 1.5 g | 22 g |
| Alcohol | 0 % vol | 0 % vol | 0 % vol | 0 % vol | 0 % vol | 0 % vol | 0.02 % vol |
| Vitamin A | 161 µg | 197 µg | 0 µg | 0 µg | 88.2 µg | 638 µg | 110,000 µg |
| Vitamin D | 1.51 µg | 4.77 µg | 0 µg | 0 µg | 0 µg | 16.6 µg | 440 µg |
| Vitamin C (ascorbic acid) | 9.07 mg | 10.7 mg | 0 mg | 0 mg | 4.3 mg | 33.1 mg | 14,400 mg |
| Potassium | 140 mg | 93.2 mg | 0 mg | 0 mg | 138 mg | 318 mg | 224,000 mg |
| Calcium | 29.9 mg | 25.5 mg | 0 mg | 0 mg | 24 mg | 80 mg | 357 mg |
| Iron | 0.865 mg | 0.514 mg | 0 mg | 0 mg | 0.77 mg | 1.82 mg | 4,000 mg |
| Fruits‚ vegetables‚ nuts and rapeseed‚ walnut and olive oils | 42.2 % | 25.6 % | 0 % | 0 % | 42 % | 80 % | 100 % |
| Fruits‚ vegetables‚ nuts and rapeseed‚ walnut and olive oils (manual estimate from ingredients list) | 46.1 % | 24.5 % | 7 % | 14.7 % | 41 % | 82 % | 100 % |
6,249 products
-
-
Maaltijdsalade mango hazelnoten - Albert Heijn Terra - 400 g
-
Basismaaltijdsalade kip - Plus

-
-
Aspergesalade - Streeckgenoten - 300 g
-
Eiersalade - HEMA
-
Bio Deluxe-Salat - Spar Natur*Pur - 100 g
-
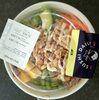
Poke bowl kip
-
Salade auvergnate cochonnaille - La Toque Bourbonnaise
-
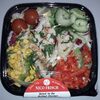
Salade grecque - L’Oste cucinamediterranea SA - 200 g
-
Maaltijdsalade Japanse noedels roerei miso dressing - Albert Heijn

-
160 g
-
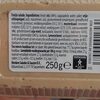
Classic Potato Salad - Woolworths - 250 g
-
Maaltijdsalade - Superunie - 450 g

-
Pikante tonijn - Albert Heijn - 150 g
-
Maaltijdsalade Tonijn - Jumbo - 450 g
-
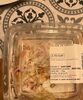
Kip Mexicaanse Stijl - Heemskerk fresh & easy
-
Asian Salad Poulet Gingembre - Sodebo

-
-
Caesar salade - Tasty times (Aldi) - 450 g

-
Pittige kipsalade - DekaVers - 150 g
-
Romige aardappelsalade - Deka - 350 g

-
Salade de lentilles aux oignons - Carrefour

-
Volkoren couscous - Albert Heijn - 200 g
-

-
Salade tagliatelles surimi estragon
-
Salade veggie

-
Maaltijd salade Libanees - Jumbo
-
Salade de calamars - Maki chef

-
Feiner Tunfisch-Salat mit Paprika, Ei & Erbsen - Penny Ready
-
Salad veggie - Bracamonte

-
Салата със зеленчуци, риба тон и яйца - Sol & Mar - 450 g
-
Салата със сурими, яйца и ананас - Sol & Mar - 450 g

-
Szamamm - 400g
-
Salade de quinoa aux légumes

-
Salade de poivrons

-
Salade de riz - Pierre martinet
-
Caesar Salad - Tasty Times - 285 g

-
Chili-Kanasalaatti - Pirkka

-
Salada de Atum com Maionese 600g - Comida Fresca - 600 g
-
Оливье Гастроном - ООО ГАСТРОНОМ
-
Maaltijdsalade gekookte rode biet - Albert Heijn - 350 g

-
Tonijnsalade - Albert Heijn
-
Salade de thon - Everyday

-
Salade saumon fumé - Le délice
-
Santini Tomatoe Salad - M&S

-
Ensalada de atún - La Campagnola - 130g
-
Seaweed Salad - Pete’s Seafood - 24 oz (680g)
-
tuna salata - eva - 160g

-
Bistro Salatcup Nizza Art - Wonnemeyer

-
Thunfisch Salat Western Style - Nixe
-
Sweet potato superfood salad - Coles - 180 g

-
Salade mechouia douce

-
Boulgour, chèvre et fèves de soja. - Mix Buffet - 200 g
-
Maaltijd salade garnaal -
-
Salade veggie - Sélect & go

-
Fruchtiger Nudelsalat - SalatFreunde - 300g
-
Insalata di tonno Cous Cous - Athena - 2 x 160 g

-
Concombre au fromage blanc - Carrefour - 500 g

-
Feta & Semi-Dried Tomato Pasta - Tesco - 290 g
-
Salade mango amandel - Albert Heijn - 260 g
-
Grana Padano Salat - Gartenfrisch - 300 g

-
Kale and Quinoa Salad - Panini Time

-
Tonijnsalade - Menken

-
viipale punajuuri - Herkkumaa - 710g
-
Tomaat komkommer salade lichtpittige groentespread - Albert Heijn - 295 g
-
Baby leaf salad - Coop - 100 g
-
Salad Italiano - F'sh Peas - 175 g
-
Kip poke - Sushi daily
-
Tonijnsalade - Menken - 250 g
-
Huzarensalade - Jumbo
-
Smoky Chicken Salad - GLO - 255g

-
Shawarma Chicken & Tabbouleh Salad - Sainsbury's
-
Salad to Go - Grilled Chicken - Nico Frisch - 245 g
-
Лют пипер със сметана - Meggle - 400 г

-
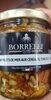
Salade de fruits de mer
-
-
Groene Boeren saladd - C.I.V. Superunie B.A. - 295 g
-
Павлак с люти чушки - Олинеза - 550 г
-
Maaltijdsalade kip sweet chili - C.I.V. Supeunie B.A. - 450 g

-
-
Caesar Salat - REWE to go - 310 g
-
Vegan soya salad - Albert Heijn
-
Salade alska
-
Pastasalat - Penne Schinken - Penny Ready - 250 g

-
Ms chicken kebab
-
Maaltijdsalade Kip Ketjap - C.I.V. Superunie B.A. - 450 g

-
Maaltijdsalade Gerookte Kip - C.I.V. Superunie B.A. - 450 g

-
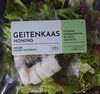
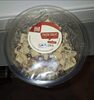
Geitenkaas Honing Groene Salade - Heemskerk Fresh & Easy
-
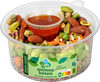
Quinoa noten salade - Albert Heijn - 205 g
-
Pasta mozzarella - Jumbo
-
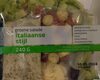
Groene salade Italiaanse stijl - C.I.V. Superunie - 240 g
-
Salade de choux - Leclerc - 120 g
-
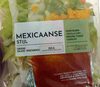
Mexicaanse stijl groene salade - Heemskerk fresh & easy
-
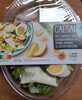
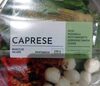
Caprese maaltijd salade - Heemskerk Fresh & Easy - 230 g
-
Pasta Salat - SNACK TIME - 250g
-
Kip Italiaanse stijl - C.I.V. Superunie B.A. - 450 g
-
Pois chiches et patates douces bio - Naturaplan - 180 g
-
Salada césar - Auchan - 190 g

-
300 g