Prepared vegetables
Belongs to:
Plant-based foods, Plant-based foods and beverages
Contains:
- Baked beans in tomato sauce
- Carrot salads
- Celeriac in remoulade sauce
- Cooked vegetables
- Frozen pre-fried cooked vegetable rosti
- Greek-style marinated mushrooms
- Grilled peppers
- Mashed vegetables
- Prepared carrots
- Ratatouille
- Refried beans
- Rice stuffed tomatoes
- Spinach with cream sauce
- Stuffed peppers
- Stuffed tomatoes
- Stuffed vegetables
- Vegetable patties
- Vegetables macedoines
- es:Alubias con verduras
- fr:Aubergines préparées
- fr:Haricots préparés
Nutrition facts
Average nutrition facts for the 4284 products of the Prepared vegetables category for which nutrition facts are known (out of 4602 products).
| Nutrition facts | As sold for 100 g / 100 ml |
Standard deviation | Minimum | 10th centile | Median | 90th centile | Maximum |
|---|---|---|---|---|---|---|---|
| Energy |
362 kj (87 kcal) |
161 kj (39 kcal) |
0 kj (0 kcal) |
146 kj (35 kcal) |
343 kj (82 kcal) |
669 kj (162 kcal) |
3,450 kj (825 kcal) |
| Fat | 3.61 g | 3.3 g | 0 g | 0.3 g | 2.7 g | 10 g | 99 g |
| Saturated fat | 0.578 g | 0.609 g | 0 g | 0 g | 0.4 g | 1.9 g | 28 g |
| Monounsaturated fat | 0.566 g | 0.996 g | 0 g | 0 g | 0 g | 3.2 g | 38 g |
| Polyunsaturated fat | 0.604 g | 0.936 g | 0 g | 0 g | 0.2 g | 2.8 g | 17 g |
| Trans fat | 0 g | 0 g | 0 g | 0 g | 0 g | 0 g | 1.04 g |
| Cholesterol | 0.27 mg | 0.958 mg | 0 mg | 0 mg | 0 mg | 4 mg | 40 mg |
| Carbohydrates | 8.5 g | 4.46 g | 0 g | 3.6 g | 6.8 g | 17 g | 91.7 g |
| Sugars | 3.04 g | 1.85 g | 0 g | 0.6 g | 2.9 g | 6.3 g | 60 g |
| Added sugars | 1.17 g | 2.57 g | 0 g | 0 g | 0 g | 8.46 g | 26.7 g |
| Fiber | 3.19 g | 1.3 g | 0 g | 1.49 g | 3 g | 5.5 g | 79 g |
| Proteins | 2.65 g | 1.81 g | 0 g | 0.8 g | 1.9 g | 6 g | 57 g |
| Salt | 0.729 g | 0.289 g | 0 g | 0.2 g | 0.713 g | 1.2 g | 800 g |
| Alcohol | 0 % vol | 0 % vol | 0 % vol | 0 % vol | 0 % vol | 0 % vol | 0 % vol |
| Vitamin A | 7.83 µg | 24.2 µg | 0 µg | 0 µg | 0 µg | 46.2 µg | 312,000,000 µg |
| Vitamin D | 0 µg | 0 µg | 0 µg | 0 µg | 0 µg | 0 µg | 0 µg |
| Vitamin C (ascorbic acid) | 0.916 mg | 1.9 mg | 0 mg | 0 mg | 0 mg | 3.4 mg | 120 mg |
| Vitamin B9 (Folic acid) | 48.8 µg | 41.2 µg | 0 µg | 3.2 µg | 40 µg | 128 µg | 130 µg |
| Potassium | 295 mg | 71.1 mg | 0 mg | 166 mg | 300 mg | 392 mg | 6,640 mg |
| Calcium | 33.9 mg | 10.5 mg | 0 mg | 16 mg | 31 mg | 50 mg | 362 mg |
| Iron | 1.46 mg | 0.426 mg | 0 mg | 0.84 mg | 1.38 mg | 2.23 mg | 10.1 mg |
| Fruits‚ vegetables‚ nuts and rapeseed‚ walnut and olive oils | 73.2 % | 24.6 % | 0 % | 0 % | 78 % | 100 % | 100 % |
| Fruits‚ vegetables and nuts - dried | 0.436 % | 1.07 % | 0 % | 0 % | 0 % | 3.1 % | 33 % |
| Fruits‚ vegetables‚ nuts and rapeseed‚ walnut and olive oils (manual estimate from ingredients list) | 76.9 % | 11.9 % | 0 % | 53.2 % | 80 % | 92.5 % | 100 % |
4,591 products
-
Mexicaanse roerbakmix - Jumbo

-
Bourgondische mini krieltjes - Jumbo - 600 g
-
Broccoli bites - Simply Nature - 12 oz
-
Macedoine legumes - Carrefour - 500 g

-
Choux fleur à l asiatique - Picard
-
Heinz
-
Heinz
-
Baked Beans - Branston - 4x 410 g

-
Saladinettes - 500 g

-
Les Rösti à l’huile de tournesol - Pom'Lisse - 600 g
-
Batchelors Baked Beans In Tomato Sauce - 420 g

-
Beans - Batchelors - 225g
-
Baked beans in tomato sauce - Smart Buy
-
PETITS POIS Doux - Auchan - 0.75 kg
-
Frijoles Bayos Enteros - La Costeña - 400 g

-
Barbecue beans - Heinz - 390 g
-
-
Letscho Paprika in pikanter Tomatensauce - Beste Ernte - 680 g
-
Baked Beans in Tomato Sauce - Macro
-
Baked beans with Sausages - Watties - 420g
-
Oak Baked Beans in Tomato Sauce - 420 g
-
Carottes râpées citron de Sicile - Bonduelle
-
Baked Beans & Pork Sausages - Lidl

-
Italiaanse roerbakmix - Jumbo
-
-
Piperade au piment d'Espelette - Saint eloi - 400 g

-
Couscous aux 7 légumes - Prosain - 1 kg

-
Epinards en branches à la crème - Findus - 480 g

-
Heinz Beanz Baked Beans - 415g

-
Tomato Sauce & Pork Baked Beans - Western Family - 398 mL
-
Carrot and parsnip mash - Lidl - 400 g

-
Hak Witte Bonen In Tomatensaus
-
HAK rode kool met stukjes appel
-
Rode bieten met ui - Hak
-
Rode kool met stukjes appel - Hak
-
Miditerraanse roerbakmix - Jumbo - 400 g
-
Beetroot and carrot salad - Meadow Fresh - 200g
-
Tomato Sauce Baked Beans - Western Family - 398 mL
-
Macédoine à la pomme de terre - D'aucy - 265 g
-
Knorr mouline tomate 1l - 1000 ml

-
Refried beans - Old El Paso - 435g
-
Fried shallot - Dragon And Phoenix - 100 g

-
biologische rode bieten gekookt - albert heijn - 250 g
-
Ratatouille - Auchan - 0.65 kg

-
Watties Baked Beans in Tomato Sauce - 220 g

-
Eco+ - 500 g e

-
Ratatouille à la provencale - Franprix - 520 g
-
Baked Beans 50% less added sugar - Watties - 420 g
-
Killer Beans Fuego Chilli - F. Whitlock & Sons - 420g

-
Watties baked beans in tomato sauce handy pack - 3 x 420 g
-
Poelee parisienne dy 700g - D'aucy - 700 g
-
Céleri Rémoulade - Carrefour - 300 g
-
Poivrons Grillés à l'Huile Bio - La Fourche - 0,19 kg
-
Pommes Croustine - Findus - 420 g
-
Macédoine de légumes - Auchan - 0.6 kg
-
Macédoine de légumes - Auchan - 0.2 kg

-
Macédoine de légumes - Auchan - 0.4 kg

-
Trio de poivrons aubergines - Saclà - 190g

-
Purée de courgettes et pommes de terre - Netto

-
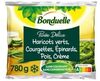
Purée délice - haricots verts, courgettes, épinards, pois, crème - 4 saveurs - Bonduelle - 780 g
-
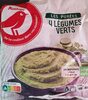
4 legumes verts - Auchan - 0.8 kg
-
Poêlée de choux et légumesBrocolis, choux-fleurs, haricots verts, carottes et oignons - Auchan - 0.75 kg
-
Purée de potimarrons Bio - Auchan - 0.6 kg

-
Poivrons Rouges Grillés - Auchan - 0.28 kg
-
Purée 3 légumes issus de l'agriculture biologique - Auchan Bio - 0.6 kg
-
Purée de céleris cuisinée - Auchan - 0.8 kg
-
Purée de carottes cuisinée - Auchan - 0.8 kg
-
Purée de brocolis cuisinée - Auchan - 0.8 kg
-
Haricots blancs à la tomate - Auchan - 0.8 kg

-
Haricots blancs à la Tomate - Jardin biologique - 680 g

-
Haricots blancs cuisinés à la tomate - Monoprix - 400 g

-
La riste d’aubergines - Jean Martin

-
Poêlée De Legumes Verts - Picard - 1 kg e
-
-
Boulettes de boeuf Viande de Boeuf Française oignons cuites - U - 300 g
-
Macédoine de Légumes - Bonduelle - 320 g

-
Mexican style chili beans - Santa Maria - 410g
-
Mini-Röstis pommes de terre et emmental - Fleury Michon - 260 g

-
Carottes râpées - Saint eloi
-
Croustis de legumes - Bonduelle

-
Maquereaux - Saupiquet - 120 g

-
Baked Beans with Meatballs - Wattie's - 420 g
-
Macédoine de légumes - U - 300 g
-
-
Ratatouille - Cassegrain
-
Carottes râpées - florette
-
Baked Beans - Asda
-
Aardappelschijfjes - Albert Heijn

-
La Poêlée Champêtre - Bonduelle - 950 g

-
Ratatouille cuisinée à la provençale - Cassegrain - 660 g

-
Baked Beans Lite - Watties - 420g

-
Watties Baked Beans in Tomato Sauce - Wattie's - 3.0kg

-
Watties Baked Beans with Sausages - 300 g

-
Céleri - Auchan - 1 kg

-
Petits pois à l'étuvée très fins - Auchan - 0.8 kg
-
Céleri Rémoulade - Auchan - 0.3 kg

-
Cauliflower & Humus - Coop Betty Bossi - 130 g
-
Mah Mee - Coop Betty Bossi - 400 g

-
Celeriac remoulade - Waitrose

-
Witte bonen in tomatensaus - Ekoplaza - 360 g