Refrigerated foods - Page 11
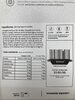
Nutrition facts
Average nutrition facts for the 1949 products of the Refrigerated foods category for which nutrition facts are known (out of 2044 products).
| Nutrition facts | As sold for 100 g / 100 ml |
Standard deviation | Minimum | 10th centile | Median | 90th centile | Maximum |
|---|---|---|---|---|---|---|---|
| Energy |
748 kj (182 kcal) |
305 kj (74 kcal) |
2 kj (0 kcal) |
280 kj (67 kcal) |
721 kj (177 kcal) |
1,260 kj (303 kcal) |
3,110 kj (744 kcal) |
| Fat | 9.07 g | 5.5 g | 0 g | 2.17 g | 8.1 g | 19.9 g | 83 g |
| Saturated fat | 3.07 g | 2.81 g | 0 g | 0.4 g | 2 g | 9.3 g | 304 g |
| Monounsaturated fat | 4.2 g | 3.74 g | 0.5 g | 0.6 g | 3 g | 14 g | 20 g |
| Polyunsaturated fat | 2.14 g | 1.93 g | 0.3 g | 0.5 g | 1.4 g | 6.9 g | 37 g |
| Trans fat | 0.247 g | 0.384 g | 0 g | 0 g | 0 g | 1 g | 3 g |
| Cholesterol | 17.7 mg | 30.7 mg | 0 mg | 0 mg | 0 mg | 100 mg | 125 mg |
| Carbohydrates | 14.5 g | 8.59 g | 0 g | 2.5 g | 14 g | 29.2 g | 83.4 g |
| Sugars | 3.03 g | 3.07 g | 0 g | 0.5 g | 2.1 g | 10.4 g | 51 g |
| Added sugars | 6.05 g | 5.23 g | 0 g | 0 g | 9.47 g | 12.6 g | 20.5 g |
| Fiber | 1.69 g | 1.32 g | 0 g | 0 g | 1.5 g | 4.2 g | 29 g |
| Proteins | 7.17 g | 3.75 g | 0 g | 1.5 g | 6.9 g | 14 g | 43 g |
| Salt | 0.972 g | 0.478 g | 0 g | 0.17 g | 0.95 g | 1.8 g | 2,980 g |
| Alcohol | 0.191 % vol | 0.502 % vol | 0 % vol | 0 % vol | 0 % vol | 1.8 % vol | 3 % vol |
| Vitamin A | 178 µg | 240 µg | 0 µg | 0 µg | 65 µg | 930 µg | 228,000 µg |
| Vitamin D | 1.03 µg | 1.46 µg | 0 µg | 0 µg | 0.842 µg | 7.5 µg | 50 µg |
| Vitamin C (ascorbic acid) | 15.2 mg | 12.7 mg | 0 mg | 1 mg | 17 mg | 42 mg | 50 mg |
| Calcium | 156 mg | 135 mg | 0 mg | 11.1 mg | 120 mg | 510 mg | 1,010 mg |
| Phosphorus | 72.4 mg | 30.9 mg | 8.42 mg | 31.3 mg | 72.7 mg | 117 mg | 412 mg |
| Iron | 1.6 mg | 1.92 mg | 0 mg | 0.017 mg | 1.01 mg | 4 mg | 16 mg |
| Fruits‚ vegetables‚ nuts and rapeseed‚ walnut and olive oils | 25.6 % | 26.7 % | 0 % | 0 % | 14.3 % | 78.4 % | 100 % |
| Fruits‚ vegetables and nuts - dried | 0.005 % | 0.014 % | 0 % | 0 % | 0 % | 0.05 % | 100 % |
| Fruits‚ vegetables‚ nuts and rapeseed‚ walnut and olive oils (manual estimate from ingredients list) | 30.2 % | 24 % | 0.4 % | 6 % | 20.2 % | 80 % | 100 % |
2,032 products
-
Flans saveur Vanille nappés caramel - Top budget - 12 * 100 g

-
Riz cantonnais LE CANTONNAIS barquette - Sa-Thô - 300 g
-
Saucisses Porc - Panais et Curry - La Popote Compagnie - 200 g

-
Carpaccio de Saumon et sa Marinade - La Cuisine du Poissonnier - 155 g
-
Penne Sauce Caesar Poulet Rôti - Pierre Martinet - 220 g
-
Riz cantonais - Asia Traiteur - 0,300 kg
-
Coquillettes jambon fromage - Cora - 300 g e
-
Choc tofee - Nestlé - 400 g e (4 * 100 g)

-
Curry indien légumes et riz - Fleury Michon - 300 g
-
Far Breton Pruneaux - Crêperie Colas - 480 g
-
Paella royale - Kerméné - 1000 g
-
Choucroute Cuite au Naturel - André Laurent - 1 kg
-
Summer rolls with shrimps - Migros - 220 g

-
Moelleux au Chocolat - Leader Price - 450 g

-
Jambon à la Broche Sans Couenne - Madrange - 140 g e
-
Champignon de Paris à la Grecque et Confiture d'Oignons - Mix Buffet

-
Jamon - Qualtia - 250 g

-
Patatiflette au Maroilles - SDB Traiteur - 450 g
-
Fiori all' Arrabbiata - Naturaplan - 250 g
-
Yaourt à la Myrtille - Les Prairies de la Gartempe - 500 g (4 * 125 g)

-
Choucroute Cuisinée à la Graisse d'Oie, Riesling et Lardons - René Weber & Fils - 1 kg

-
Profiteroles, Sauce au Chocolat Noir - Milbona - 180 g (2 * 90 g e)

-
Lait Choco Frais - Luxlait - 500 ml e

-
Bouchée à la Reine - Intermarché - 300 g

-
Beurre de Baratte - Maison Deret - 250 g

-
Chicken Korma with Spiced Basmati Rice - Marks & Spencer - 365 g e

-
Mayonnaise artisanale - J.C.David - 135g
-
Falafel premium farcis à l'hummus - SOTO
-
Le Torchon Cuit à l'Étouffée - Fleury Michon - 200 g e
-
Falafel - Fit Food - 220 g
-
Pâté en Croûte en Bloc - €co Gourmand - 550 g

-
Saucisse Barbecue - Charcuterie Serres

-
1 Paris-Brest - Hafner - 75 g

-
Choucroute Cuisinée - Choudor - 650 g

-
Sweet & Sour Chicken - Marks & Spencer - 400 g e
-
Rydbergs - 800 g

-
Oeufs pochés au jambon et à la ciboulette - monoprix - 180 g

-
Lasagne à la Bolognaise - STEFANO TOSELLI - 3 kg

-
Yogurt tipo Griego - Colinas del Sol - 180 g

-
Pavé Le Montagnard - Jambon, Raclette, Pain aux Graines - Daunat - 180 g

-
Yahourt grec - Meandros

-
Salade de Pâtes, Fromage Feta et Tomates Rôties Lentement - Marks & Spencer
-
Ma Tarte à la Bourbonnaise - Pierre Clot - 350 g

-
Soupe gaspacho à l'Andalouse - Liebig - 50 cl e

-
Roast chicken - Fleury Michon - 900 g e

-
Paniers de Yoplait Plein de bons fruits - 2 kg (16 x 125 g)

-
Soup' Bistrot, Légumes Fromage Frais - Liebig - 74 cl

-
Yaourt Bio Plein d'Abricots - Pur Natur
-
Vegetable Selection with Mint Butter - Marks & Spencer - 300 g e

-
L'Instant Bagel - Bœuf Pastrami Cornichons & Cream Cheese - Sodebo - 210 g

-
La Craquante Londonienne - Mix - 250 g e
-
Pot'Je Vlesh - St Gery - 3,264 kg
-
Allumettes 7mm - Lutosa - 10 kg (2 * 5 kg e)

-
Chipotle Chicken with Rice, Chickpeas, Fresh Spinach and Smoky Tomato Salsa Sauce - Marks & Spencer - 300 g
-
Salade Super Complète aux Fruits à Coque - Marks & Spencer - 285 g
-
Salade Repas Taboulé Tutti Fruiti - Jardin Bio - 240 g
-
Lasagne au chou kale et à la viande bovine - U - 350 g

-
Eliopitta - Andréas Mavrommatis - 125 g

-
Pizza Tartiflette - Leclerc

-
Museau de bœuf assaisonné - Sans marque - 300 g e

-
Danette Caramel - Danone - 500 g e (4 * 125 g)

-
Profiteroles à la Crème Pâtissière et Sauce au Chocolat - Excellence - 500 g e

-
Panier de Yoplait L'Original Pomme Poire - 500 g (4 * 125 g)
-
Beurre Demi-Sel - Belle France - 125 g
-
Yaourt Nature - Les Trois Chênes - 500 g

-
Brandade de Morue - Tous les Palais du Monde - 300 g
-
Puff Pastry Steak & Ale Pie - Marks & Spencer - 200 g e
-
Le vegetal escalope pannees de soja - Monoprix - 200 g
-
Semoule au Caramel - Bonne Maman - 800 g (8 * 100 g)

-
Graines de salade - Bonduelle - 300 g
-
Grignottes de poulet à l'Indienne - Lidl - 250 g
-
Léger (11 % MG) - Président - 250 g

-
Yogurello Escolar sabor Frutilla - Pil - 100 ml

-
Salade de museau de boeuf ravigote - SARL Vivant - 400 g
-
Galettes fromage de chèvre et tomates à la provençale - La Crêpe de Broceliande - 300 g (2 * 150 g)

-
Cheddar - La Serenisima - 180 g

-
La Purée Légumes Oubliés - Créaline - 400 g e (2 * 200 g)
-
L'Ecrasé Pommes de terre aux choux-fleurs - Créaline - 400 g e (2 * 200 g)
-
La Purée Petits Pois - Créaline - 400 g e (2 * 200 g)
-
Civet de Cerf Mariné - Saveurs Forestières - 1 kg
-
Calamars au piment d'Espelette marinés aux poivrons - L'Apéro du Poissonnier - 120 g

-
Pizza Chorizo Emmental - Netto - 450 g
-
Crique ardéchoise - Boucheries André - 4 pièces
-
Catupiry Requeijão Cremoso Light - 200 g

-
Yaourts aux Fruits - Pêche - Tous les jours - 500 g (4 * 125 g)

-
Panier de Yoplait Framboise Mûre - 500 g e (4 * 125 g)

-
Délice au Saumon & Épinard - Tempé - 320 g

-
2 Quiches Lorraines - Netto
-
Pâte fraîches aux œufs farcies aux carottes - Kitchen Garden
-
Soupe Chou Kale Orge perlé - Giraudet - 50 cl

-
Chicken In Cream Mushroom Sauce - Marks & Spencer - 370 g

-
Pollo alla parmigiana con penne - Wetaca - 520 g

-
Riz crevettes au curry vert - Yedo Sushi - 340 g
-
Lasaña romana - Wetaca - 450g
-
La Tourte Lentins de chêne Volaille - Champichoux - 520 g

-
La soupe Poivron rouge Ail - Les Petites Bio'teilles

-
Soupe petits pois menthe - Giraudet - 50 cl

-
Yaourt Pomme Verte Kiwi - Mamie Nova - 300 g (2 * 150 g)
-
Falafel - Schysst käk - 330g

-
Mini-Muffins Abricot Sec & Brie - Escale Gourmande - 120 g