Rice dishes - Page 23
Nutrition facts
Average nutrition facts for the 3167 products of the Rice dishes category for which nutrition facts are known (out of 3266 products).
| Nutrition facts | As sold for 100 g / 100 ml |
Standard deviation | Minimum | 10th centile | Median | 90th centile | Maximum |
|---|---|---|---|---|---|---|---|
| Energy |
853 kj (207 kcal) |
421 kj (101 kcal) |
0 kj (0 kcal) |
439 kj (105 kcal) |
640 kj (155 kcal) |
1,520 kj (362 kcal) |
5,380 kj (1290 kcal) |
| Fat | 3.66 g | 2.18 g | 0 g | 0.85 g | 3.3 g | 7.8 g | 53 g |
| Saturated fat | 1.08 g | 0.987 g | 0 g | 0 g | 0.8 g | 3.1 g | 22 g |
| Monounsaturated fat | 0.972 g | 1.39 g | 0 g | 0 g | 0.6 g | 3.5 g | 11.9 g |
| Polyunsaturated fat | 0.698 g | 1.03 g | 0 g | 0 g | 0.3 g | 3.1 g | 4.17 g |
| Trans fat | 0 g | 0 g | 0 g | 0 g | 0 g | 0 g | 1.32 g |
| Cholesterol | 0.453 mg | 1.74 mg | 0 mg | 0 mg | 0 mg | 5 mg | 44 mg |
| Carbohydrates | 34.1 g | 25.9 g | 0 g | 12 g | 19 g | 76.3 g | 91 g |
| Sugars | 1.72 g | 1.14 g | 0 g | 0.4 g | 1.5 g | 4.17 g | 79 g |
| Fiber | 1.9 g | 1.24 g | 0 g | 0.6 g | 1.6 g | 4.4 g | 60 g |
| Proteins | 6.68 g | 2 g | 0 g | 3.3 g | 6.8 g | 9.8 g | 49 g |
| Salt | 1.1 g | 0.784 g | 0 g | 0.3 g | 0.81 g | 2.87 g | 78.6 g |
| Alcohol | 0 % vol | 0 % vol | 0 % vol | 0 % vol | 0 % vol | 0 % vol | 0.3 % vol |
| Vitamin A | 69.9 µg | 88.8 µg | 0 µg | 0 µg | 42.9 µg | 267 µg | 1,930 µg |
| Vitamin D | 0.245 µg | 0.427 µg | 0 µg | 0 µg | 0 µg | 1.11 µg | 1.4 µg |
| Vitamin C (ascorbic acid) | 5.76 mg | 7.97 mg | 0 mg | 0 mg | 2.1 mg | 23.8 mg | 67.7 mg |
| Vitamin B1 (Thiamin) | 0.449 mg | 0.491 mg | 0 mg | 0 mg | 0 mg | 1 mg | 670 mg |
| Vitamin B2 (Riboflavin) | 0.172 mg | 0.055 mg | 0 mg | 0.097 mg | 0.165 mg | 0.247 mg | 60.7 mg |
| Vitamin B3/PP (Niacin) | 3.96 mg | 0.968 mg | 0 mg | 2.81 mg | 4 mg | 5.61 mg | 22.6 mg |
| Vitamin B6 (Pyridoxin) | 0.605 mg | 0.574 mg | 0.14 mg | 0.329 mg | 0.399 mg | 2.26 mg | 700 mg |
| Vitamin B9 (Folic acid) | 80.3 µg | 34 µg | 0 µg | 45 µg | 67 µg | 146 µg | 279 µg |
| Folates (total folates) | 144 µg | 50.6 µg | 18 µg | 56 µg | 159 µg | 214 µg | 257 µg |
| Potassium | 254 mg | 126 mg | 0 mg | 104 mg | 225 mg | 509 mg | 100,000 mg |
| Calcium | 44.7 mg | 28.6 mg | 0 mg | 0 mg | 38 mg | 96 mg | 32,000 mg |
| Phosphorus | 214 mg | 97.7 mg | 53.6 mg | 53.6 mg | 236 mg | 346 mg | 346 mg |
| Iron | 2.57 mg | 1.24 mg | 0 mg | 0.64 mg | 2.67 mg | 4.44 mg | 1,400 mg |
| Fruits‚ vegetables‚ nuts and rapeseed‚ walnut and olive oils | 16.8 % | 11.3 % | 0 % | 0 % | 16.8 % | 37.3 % | 71.6 % |
| Fruits‚ vegetables and nuts - dried | 1.59 % | 4.86 % | 0 % | 0 % | 0 % | 25 % | 35 % |
| Fruits‚ vegetables‚ nuts and rapeseed‚ walnut and olive oils (manual estimate from ingredients list) | 17.8 % | 9.91 % | 0 % | 6 % | 17.5 % | 39 % | 67.7 % |
3,268 products
-
Merlu, risotto aux petits pois - Seazon

-
Poulet au curry vert & courgettes - SEAZON - 390 g
-
Risotto aux petits pois bio et à la menthe - Seazon - 420 g
-
Poulet Teriyaki - Seazon - 410 g
-
Korma poulet et riz basmati - Isali
-
Curry vert de legumes - Seazon - 400 g

-
Paella - - 3 kg

-
Arroz 3 delicias - Unide

-
Cabillaud, riz, courgettes au curry et citron - Par Ici Cuisine - 290 g
-
Mon plat Gourmand - Findus

-
Crispy sweet & sour chicken with egg fried rice - Sainsbury’s
-
Biologische nasi kipsate - Marqt - 450 g

-
Pad kra pao gai, poulet basilic - Seazon - 380 g

-
Chicken & Black Bean With Egg Fried Rice - Tesco
-
Rice a roni hot & spicy jalapeno cheddar rice
-
Vegetarian Mushroom stroganoff & rice - Asda

-
Cajun rice - 68 g

-
Chicken and prawn paella - Asda

-
Risotto aux Asperges - BREMOND Fils
-
Poulet curry coco et riz - Rochambeau - 300 g

-
Paëlla - Toupargel
-
Poulet au curry et son riz - Comme j'aime - 285 g
-
Dos de cabillaud à la provençale et riz aux légumes - Toupargel - 350 g

-
Paella royale - Toupargel - 450 g
-
Goodie - Prozis

-
Risotto Zafferano - Sapori d'Italia - 300 g
-
Calorie Controlled Chicken Curry - Morrisons - 350 g

-
Dahl de lentilles - Mmmh - 400g

-
Risotto ai Carciofi - Brezzo
-
Chicken curry - Good Choice - 350g
-
Risotto al Gusto di Tartufo - Da Emilio - 250g

-
Panang curry meal kit - Coles - 700 g
-
Risotto Nature - Good Choice - 350 g
-
Biryani meal kit - Coles - 355 g
-
Da Emilio Risotto pomodore e basilico - 250g
-
Risotto con funghi - Subito

-
Pumpkin Risotto - Coles - 350 g

-
Creamy risotto - Chiefs
-
Gemüse Risotto - Oswald - 300g

-
Earthly Grains New Orleans Style Dirty Rice - 8 oz
-
Risotto Milanese - Subito - 90g
-
Risotto aux bolets - Oswald
-
Chicken and black bean sauce with egg fried rice - Morrisons
-
Risotto au fromage - Denner

-
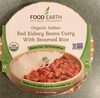
Red Kidney Beans Curry with Steamed Rice - Food Earth - 10.58 oz
-
Risotto - - 1 kg

-
Poulet Basquaise & Riz - Baton Rouge

-
Paella de Verduras - Trevijano - 280g
-
Risotto - Lidl
-
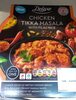
Chicken Tikka Masala with pilau rice - Lidl
-
Mushroom Risotto - Good Chef
-
Petite bowl - SOGOOD - 128
-
Risotto à la Truffe - Casale Paradiso - 250 g

-
Chicken and chorizo rice - 350 g
-
Paella - Coop

-
Thai Curry Penang avec du riz à la noix de coco - Karma - 400 g
-
Risotto au Safran - Al dente

-
Risotto - 210 g

-
Paella -

-
Hot & spicy buffalo chicken flavor rice, cayenne red pepper sauce and chicken - Rice A Roni

-
Brown Rice, Quinoa & Chia Seeds with Garlic - Macro - 250 g
-
Paella saporita - Esselunga

-
Chinese style chicken curry with egg fried rice - Tesco
-
Kumoroll - Saumon Cream Cheese - Kumo - 300 g
-
Thai chicken curry & rice - 350 g

-
Poulet Stroganoff - Anna's Best - 400 g

-
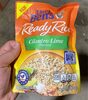
Classic Cilantro Lime Rice - Vigo - 2 lb
-
Cilantro Lime Rice Blend - Path of Life - 5 x 10 oz

-
Paella marinera - 1 kg
-
Paella fruit de mer et poulet
-
Cilantro Lime Dry Rice Mix - Good & Gather - 274 g

-
Paella royale

-
Cilantro Lemon Flavored Ready Rice - Uncle Ben's - 8.5 oz
-
Paella Rustica - Fruits de mer et Chorizo

-
Paella

-
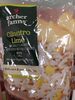
Cilantro Lime Rice - Archer Farms
-
Paëlla valenciana - Carrefour

-
Bens Original Express Rice Korean BBQ - - 240 g
-
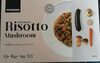
Dehydrated Risotto Mushroom - Prozis - 280 g
-
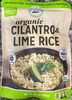
Organic Cilantro & Lime Rice - - 8.8 oz
-
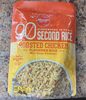
90 second rice roasted chicken flavored - Schnucks
-
Risotto - Roland
-
Risotto avec morilles - Subito - 250 g
-
Risotto pomodoro e basilico

-
Risotto à l'ail des ours - Coop Betty Bossi

-
Risotto al gusto di tartufo
-
Risotto mix - Migros Bio
-
Inde Poulet Madras et pommes de terre cuisinées surgelés - Picard - 350 g
-
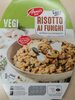
Risotto al funghi - Migros
-
Dinde à l'Indienne et son Riz Basmati aux Légumes - Comme j'aime - 285 g

-
Risotto à l’arome de truffe - Denner
-
Risotto Tomato - 250 g

-
Risotto

-
Risotto agli asparagi - Migros

-
Risotto aux noisettes
-
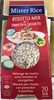
Risotto Funghi
-
Risotto met Champignons - Lidl
-
Risotto aux asperges
-
Risotto asperges - M-Budget - 250g
-
Risotto ai porcini - Sapori d'Italia
