Squeezed orange juices - Page 3
Belongs to:
Squeezed juices, Orange juices, Fruit juices, Juices and nectars, Fruit-based beverages, Plant-based beverages, Beverages, Plant-based foods and beverages, Beverages and beverages preparations
Nutrition facts
Average nutrition facts for the 963 products of the Squeezed orange juices category for which nutrition facts are known (out of 1049 products).
| Nutrition facts | As sold for 100 g / 100 ml |
Standard deviation | Minimum | 10th centile | Median | 90th centile | Maximum |
|---|---|---|---|---|---|---|---|
| Energy |
180 kj (43 kcal) |
13 kj (3 kcal) |
8 kj (2 kcal) |
159 kj (38 kcal) |
180 kj (43 kcal) |
201 kj (48 kcal) |
700 kj (167 kcal) |
| Fat | 0.167 g | 0.206 g | 0 g | 0 g | 0.1 g | 0.5 g | 71 g |
| Saturated fat | 0.026 g | 0.043 g | 0 g | 0 g | 0 g | 0.1 g | 3.5 g |
| Trans fat | 0 g | 0 g | 0 g | 0 g | 0 g | 0 g | 0 g |
| Cholesterol | 0 mg | 0 mg | 0 mg | 0 mg | 0 mg | 0 mg | 0 mg |
| Carbohydrates | 9.58 g | 0.781 g | 7.5 g | 8.6 g | 9.4 g | 11 g | 87 g |
| Sugars | 9.05 g | 0.559 g | 0 g | 8.3 g | 9 g | 10 g | 15.2 g |
| Fiber | 0.366 g | 0.249 g | 0 g | 0 g | 0.5 g | 0.8 g | 2.7 g |
| Proteins | 0.645 g | 0.128 g | 0 g | 0.5 g | 0.7 g | 0.8 g | 7.5 g |
| Salt | 0.006 g | 0.009 g | 0 g | 0 g | 0 g | 0.03 g | 1 g |
| Alcohol | 0 % vol | 0 % vol | 0 % vol | 0 % vol | 0 % vol | 0 % vol | 0 % vol |
| Vitamin C (ascorbic acid) | 25.4 mg | 6.27 mg | 9 mg | 20 mg | 24 mg | 36 mg | 60 mg |
| Vitamin B1 (Thiamin) | 0.022 mg | 0.066 mg | 0 mg | 0 mg | 0 mg | 0.24 mg | 63 mg |
| Vitamin B3/PP (Niacin) | 0.228 mg | 0.118 mg | 0.06 mg | 0.06 mg | 0.333 mg | 0.333 mg | 0.333 mg |
| Vitamin B6 (Pyridoxin) | 0.042 mg | 0.017 mg | 0.012 mg | 0.014 mg | 0.05 mg | 0.071 mg | 0.12 mg |
| Vitamin B9 (Folic acid) | 28 µg | 8.23 µg | 0 µg | 15.3 µg | 29 µg | 60 µg | 25,000 µg |
| Potassium | 175 mg | 21.3 mg | 0 mg | 140 mg | 188 mg | 190 mg | 200 mg |
| Calcium | 17.5 mg | 17.2 mg | 4 mg | 8 mg | 8.33 mg | 60.8 mg | 146 mg |
| Iron | 0.058 mg | 0.054 mg | 0 mg | 0 mg | 0.09 mg | 0.2 mg | 0.2 mg |
| Magnesium | 8.91 mg | 1.92 mg | 4.17 mg | 4.17 mg | 10 mg | 11 mg | 11 mg |
| Fruits‚ vegetables‚ nuts and rapeseed‚ walnut and olive oils | 100 % | 0 % | 100 % | 100 % | 100 % | 100 % | 100 % |
| Fruits‚ vegetables‚ nuts and rapeseed‚ walnut and olive oils (manual estimate from ingredients list) | 100 % | 0 % | 100 % | 100 % | 100 % | 100 % | 100 % |
1,047 products
-
Simply Orange Juice (Calcium, Vitamin D, Pulp Free) - 1.53 l

-
Orange - Tropicana - 25 cl

-
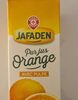
Pur Jus d'orange - Jafaden - 1 l
-
Tropicana Orange avec pulpe 25 cl

-
Pur jus d'orange - plein fruit - 20 cl

-
Pur jus d'oranges pressées avec pulpe réfrigéré - U - 1 l

-
Smooth Orange - Copella

-
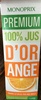
Premium 100% Jus d'orange - Monoprix - 1 L
-
100% Pur Jus ORANGE - Casino - 1 l
-
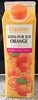
Orange du brésil - Monoprix Gourmet - 1 L
-
Pur jus d’orange - Solevita

-
Zumo de naranja 100% exprimido - Eroski

-
Pur jus orange - Jafaden - 1,5L
-
Le pur jus orange IGP Valencia - Cidou - 1l
-
Le fruit - Joker - 2l
-
Pur jus d'orange de Méditerranée bio - Vitamont
-
Tropicana Pure premium oranges pressées avec pulpe 1 L - 1000 ml

-
Tropicana Pure premium oranges pressées sans pulpe 1 L - 1000 ml
-
Orange juice - Solevita - 1 l
-
Joker - 1,25 L

-
Orangensaft mit Fruchtfleisch - Rewe Beste Wahl - 1 l
-
Jus d’Orange - Solevita - 1 L
-
Premium Orangensaft Direktsaft - Kaufland - 1 l
-
Tropicana Bio Pur jus orange sans pulpe 85 cl - 850 ml
-
100% Pur jus orange Avec pulpe - Carrefour - 1 l

-
Pur Jus D'orange Bio Mini Brique - Vitamont
-
Jus d'orange pulpé biologique pasteurisé - Carrefour - 1 L
-
ORANGE BIO pur jus bresil - Ethiquable - 75 cl

-
Tropicana Pulpissimo extra pulpe 1 L - 1000 ml

-
100 % pur jus d'orange douce - Plein Fruit - 1 l
-
Tropicana Pure premium oranges pressées sans pulpe format familial 1,5 L - 1500 ml

-
Pur Jus Orange de Grèce - Vitamont - 75 cl
-
100 pur jus orange casino

-
Rewe Bio Orangensaft, 100% Direktsaft - 1l
-
100% Pur Jus Pressé 3 AGRUMES AVEC PULPE - Paquito - 1000 ml
-
100% Pur Jus Orange Naturellement source de vitamine C - Casino - 1,5 l

-
Pur jus d'orange bio - Plein Fruit - 1 l
-
Jus d'orange bio avec pulpe - Agidra - 75 cl
-
Orangensaft - Solevita - 1,5 l

-
Tropicana Orange avec pulpe lot de 2 x 1 L - 2000 ml

-
Tropicana Pure premium oranges pressées avec pulpe format familial 1,5 L - 1500 ml
-
Pur jus orange sanguine - Jafaden - 1 l
-
pur Jus d'orange Bio - Rik & Rok - 0.2 l
-
Orange d'Espagne100% pur jusFort et fruitéNaturellement riche en vitamines C - Auchan - 1 l

-
Jus d'orange - Le Bio pour Tous - 1 L
-
orange 100% pur jus avec pulpe - Monoprix Bio - 1L

-
Naranja 100% exprimida con pulpa - Alipende - 2l
-
Jus d’orange - Rio d'Oro - 1 litre
-
Orangendirektsaft - Rewe

-
100% pur jus orange Sans pulpe - Carrefour - 1 L

-
Pur jus d'orange sans pulpe - U - 1 l

-
Jus d'orange - Belle France - 1 L
-
Pur jus d'orange Brésil - Jafaden - 1 L
-
Pur jus d'orange - Carrefour Discount - 1 L e

-
Orange juice - alboustane

-
Mildes-Frühstück Orange - Valensina - 1 l
-
Jus d'orange - Ulti - 250 ml
-
Pur jus d’orange - Jean d'Audignac
-
Pur jus - Orange sans pulpe - Leader Price - 1 L

-
Frühstücks-Orange, ohne Fruchtfleisch - Valensina - 1,5 l
-
Jus d'Orange - Migros Bio - 75 cl
-
Orange 100% pur jus

-
Orange Direkt Gepresst - Solevita
-
Pur jus d'Orange Bio - Vallée Verte - 1 l

-
Pur jus - Joker - 1.25 L
-
Pure jus orange avec pulpe - Franprix - 1 L

-
Pur jus d'orange - Nature Bio
-
ORANGE SANS PULPE 100% pur jus - Carrefour - 1,5 l

-
100% pur jus d'Oranges sans pulpe BIO pressées - ANDROS - 75cl

-
Homegrown 100% Pure Orange Juice -

-
Pur jus d'orange pet - Casino - 2 l

-
Orange pressée sans pulpe - Tropicana

-
Pur jus d'orange - Netto
-
Pur jus orange bio - Belle France - 1 L

-
Pur jus orange - Franprix - 1 L
-
Jus d'orange avec pulpe - Tropicana - 1,5 L
-
Zumo de manzana - Gutbio - 750 ml
-
Pur jus d'orange - Solevita - 1 l

-
Tropicana Bio orange sans pulpe 75 cl - 750 ml
-
Orangensaft - Rio doro - 1liter

-
Jus d’orange pressées sans pulpe - Tropicana - 1 L

-
Les pressés orange - Jafaden - 1 l
-
Tropicana Pure premium orange sans pulpe maxi format 2 L - 2000 ml
-
Jus d'orange Jafaden Sans pulpe - 1 l
-
100% Pur Jus Orange pué Flash pasteurisé - Casino - 1 l

-
100 % Pur jus Pressé - orange - avec pulpe - Auchan - 1.5 l
-
100% Pur jus d'orange - Cora - 1 L
-
Pur jus d'orange sans pulpe - Solevita
-
100%pur jus orange flash pasteurisé - Monoprix Bio - 1 L

-
Orange avec pulpe - Innocent - 1,35 l
-
100% Pur Jus Orange avec pulpe - Casino - 1 l
-
Pur jus d'orange Bio - Bio Village - 1 l

-
100% pur jus Orange avec pulpe - FRUIMA - 1L
-
Pur jus d'orange des Amériques - U - 1 l

-
Tropicana Pure premium oranges pressées sans pulpe 1 L +10% offerts - 1100 ml

-
100 % Pur jus PRESSé - orange - avec pulpe - Auchan - 1.5 l

-
Jus d'orange Sans pulpe 100% Pur jus - Carrefour bio - 6x20 cl

-
pur Jus d'orange Bio - Rik & Rok - 1.2 l
-
Orangensaft - Rewe - 1l

-
REWE Beste Wahl Orangensaft - 1 Liter
