Strawberry yogurts - Page 3
Belongs to:
Fruit yogurts, Yogurts, Fermented dairy desserts with fruits, Fermented dairy desserts, Dairy desserts, Desserts, Fermented milk products, Fermented foods, Dairies
Nutrition facts
Average nutrition facts for the 688 products of the Strawberry yogurts category for which nutrition facts are known (out of 740 products).
| Nutrition facts | As sold for 100 g / 100 ml |
Standard deviation | Minimum | 10th centile | Median | 90th centile | Maximum |
|---|---|---|---|---|---|---|---|
| Energy |
385 kj (92 kcal) |
77 kj (19 kcal) |
0 kj (0 kcal) |
247 kj (57 kcal) |
389 kj (93 kcal) |
510 kj (123 kcal) |
1,800 kj (430 kcal) |
| Fat | 2.6 g | 1.48 g | 0 g | 0.1 g | 2.8 g | 5.2 g | 30 g |
| Saturated fat | 1.67 g | 0.977 g | 0 g | 0.1 g | 1.8 g | 3.4 g | 10 g |
| Trans fat | 0 g | 0 g | 0 g | 0 g | 0 g | 0 g | 0.096 g |
| Cholesterol | 5.94 mg | 2.91 mg | 0 mg | 2.5 mg | 5.64 mg | 11.1 mg | 23.3 mg |
| Carbohydrates | 12.8 g | 2.46 g | 0 g | 8 g | 13 g | 16.2 g | 71.4 g |
| Sugars | 11.9 g | 2.48 g | 0 g | 6.7 g | 12.1 g | 15.3 g | 57.1 g |
| Fiber | 0.224 g | 0.277 g | 0 g | 0 g | 0.1 g | 0.9 g | 14 g |
| Proteins | 3.58 g | 0.723 g | 0 g | 2.67 g | 3.5 g | 4.7 g | 54 g |
| Salt | 0.115 g | 0.027 g | 0 g | 0.08 g | 0.11 g | 0.17 g | 45.1 g |
| Alcohol | 0 % vol | 0 % vol | 0 % vol | 0 % vol | 0 % vol | 0 % vol | 0 % vol |
| Vitamin A | 61.8 µg | 46 µg | 0 µg | 0 µg | 74 µg | 134 µg | 929 µg |
| Vitamin D | 1.12 µg | 0.425 µg | 0 µg | 0.686 µg | 1.01 µg | 2.5 µg | 1,670 µg |
| Vitamin C (ascorbic acid) | 178 mg | 617 mg | 0 mg | 0 mg | 0 mg | 2,400 mg | 15,000 mg |
| Calcium | 133 mg | 49.4 mg | 0 mg | 88 mg | 121 mg | 200 mg | 160,000 mg |
| Iron | 0.041 mg | 0.08 mg | 0 mg | 0 mg | 0 mg | 0.267 mg | 132 mg |
| Fruits‚ vegetables‚ nuts and rapeseed‚ walnut and olive oils | 5.98 % | 3.86 % | 0 % | 0 % | 8 % | 11.8 % | 15 % |
| Fruits‚ vegetables‚ nuts and rapeseed‚ walnut and olive oils (manual estimate from ingredients list) | 8.83 % | 2.18 % | 0 % | 5.1 % | 9 % | 13 % | 50 % |
738 products
-
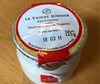
Zott - 175 g

-
Yaourts Brassés à la Fraise Senga - La Fabrik d'Anscaire - 500g (4x125g)

-
Joghurt mild - Erdbeer - Zukunftsbauer - 450 g

-
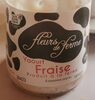
Yaourt fraise - FLEUR DE FERME
-
Délice de yaourt fraises - Alsace lait - 4 x 125 g

-
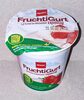
FruchtiGurt - Erdbeere - Penny - 150 g
-
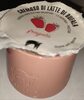
Cremoso di latte di bufala alla fragola - Azienda agricola San Salvatore - 120 g
-

-
Yaourt fraise - Prélys - 125 g

-
-
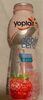
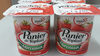
Panier de Yoplait avec Morceaux Fraise - 500 g
-
Two Good Smoothies - 207ml

-
0% fat greek style live yogurt - Irish Yogurts Clonakilty - 500 g

-
Yaourt artisanal Fraise - Ekia - 500 g (4x125g)

-
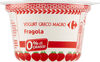
Yogurt greco magro fragola - Carrefour
-
Lisäaineeton jogurtti mansikka - Valio
-
bimbi - granarolo - 2 x 100 g
-
Erbeere - Frischgold
-
Frùttolo smarties - Nestlé - 120 g

-
Calcifem - Pil - 1000 g
-
Bio-Joghurt Erdbeere - Natur pur - 200g

-
Halfvolle Aardbeien Yoghurt - Albert Heijn - 1L
-
Yaourt de brebis bio - Fraises - Tradi-Bergère - 200 g (2x100g)

-
Strawberry Yoghurt - Barambah Organics - 500g

-
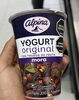
Finesse Yogurt con Probióticos Fresa - Alpina - 200 g
-
Yogur azucarado con fresas - Alipende
-
Yogur fresa - Spar - 4 x 125 g
-
yaourts sur lit de Fraise - 250 g
-
Yaourt au fraises - Ferme Baron - 125 g

-
Yogur - Nutricia

-
Yoghurt aardbei - De Zaanse Hoeve - 1 kg
-
Calci+ Frutilla y Arándanos - Ser - 120 g
-
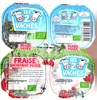
Fraise Vachement Mixée - Les 2 Vaches - 460 g (4 x 115 g)
-
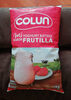
Yoghurt batido sabor frutilla - Colun - 1 kg
-
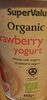
Organic strawberry yogurt - Supervalu
-
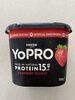
YoPRO Strawberry Yoghurt - 700g
-
Yoghurt met aardbeien - Mimosa

-
Erdbeerjoghurt - Milbona - 8 x 150 g

-
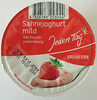
Sahnejoghurt mild Erdbeer - Jeden Tag - 150 g
-
Yogur cremoso fresa plátano - Hacendado

-
yaourt Ramdy fraise - 100g

-
Yogur con fresa - Milsani
-
Yaourt à la grecque fraise - Boni

-
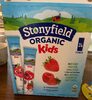
Kids 6 pk yogurt - Stonyfield - 4 ounces
-
Strawberry yogurt
-
Yaourt brassé lit de fraise - Monbertille
-
Yogourt fraise - Migros - 150 g

-
Joghurt Drink - Good milk - 500 g = 468 ml
-
Joghurt - Milbona - 150 g

-
Erdbeerjogurt - Biomilk - 180g
-
Yogourt au lait entier fraise - Cremo - 180 g
-
Yogur griego con fresa - Alteza - 500 g (4x125g)

-
Der Große Bauer, Erdbeere wenig Kalorien! - 250g
-
Aardbeien - Ella - 1000 g

-
Frutilla - Tregar - 160 g
-
BIOFERME - 125g
-
Yaourts gourmands au lait entier sur lit de fraise - Délisse - 2 x 125 g

-
Choceňský smetanový jogurt jahodový - Choceňská mlékárna - 150 g

-
Longa vida - Nestlé - 150ml
-
Yogurt cremoso - Muller - 250 g (2x125g)

-
Milder Sahne Joghurt Erdbeere - Rewe
-
Yogurt Bebidle Sabor Frutilla - Pil - 1000 g

-
Yaourt brassé sur lit de confiture de fraises - Au lait entier - Casino - 4 x 125 g

-
Yogur sabor a fresa - Auchan
-
Jogobella Yaourt Fruits - Zott - 400 g

-
Yaour à la grecque fraise zéro lactose - Dilea

-
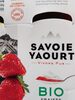
Bio fraises - Savoie Yaourt - 480 g
-
Jogurt jahodový - Clever - 400g

-
Yogur fresa sin lactosa - Froiz

-
Yogur 0% con trozos de fresa y dátil - Central Lechera Asturiana
-
Danone con Fresa - 900 g

-
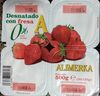
Desnatado con fresa 0% - Alimerka - 500 g
-
Activia sans lactose fraise - Danone - 480 g e (4 * 120 g)

-
Yogur desnatado 0% con fresas - Casa Grande de Xanceda

-
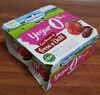
Stonyfield organic kids
-
Yogurt con fragola frullata - Arborea

-
Joghurt Spass Erdbeer - Milfina - 135 g

-
Selský jogurt jahoda - Hollandia - 330g
-
Brassé mixé à la fraise - Bio Village - 4 x 125 g
-
Nanö Strawberry - Iögo - 93 ml
-
Aardbei - Zuivelhoeve - 800 g

-
Panier de Yoplait Sensations Fraise - 125 g

-
Yogurt fragola -
-
yogurt alla fragola - Sigma

-
BIO selský jogurt jahody - Hollandia - 180g
-
Yogurt Melts Strawberry - Gerber - 1.0 oz (28 g)
-
Colchón Frutilla, arándanos y granada - Ser - 175 g
-
Yaourt sur lit de fraise bio - Savoie Yaourt - 500 g (4* 125 g)
-
Yaourt aux Fraises Plougastel - Bordier - 125 g
-
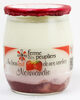
Strawberry yoghurt - Ferme des Peupliers - 125g
-
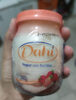
Yogur con frutillas - Dahi - 200 g
-
Yaourth luxembourg - Luxlait - 250 g (2x125 g)

-
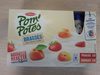
Pom'Potes Brassés Fraise Abricot - 850 g / 10 * 85 g
-
yaourt au lait entier (Fraise) - Vrai - 150 g
-
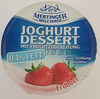
Joghurt Dessert mit Fruchtzubereitung Erdbeer - Mertinger Milchhof - 100 g
-
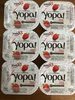
Yopa! Fraise - Yoplait - 600 g (6 * 100 g)
-
Erdbeerjogurt mit schokolierten Getreide-Kühen - Gut Bio

-
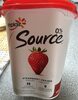
Source Strawberry Yogurt 0% M.F. - Yoplait - 650g
-
Onken Vollkorn Erdbeere - 500 g

-
Yoplait doble cero - Sigma - 242 g