Stuffed pastas
Belongs to:
Contains:
- Agnolotti
- Cannelloni
- Cooked fresh pasta stuffed with cheese and vegetables
- Fresh pasta stuffed with cheese and vegetables
- Pasta stuffed with cheese
- Pasta stuffed with fish
- Pasta stuffed with meat
- Pasta stuffed with vegetables
- Pierogi
- Ravioles du Dauphiné
- Ravioli
- Ravioli with ricotta and spinach
- Tortellini
- Tortelloni
- fr:Ravioles
- it:Agnolotti pavesi
Nutrition facts
Average nutrition facts for the 5626 products of the Stuffed pastas category for which nutrition facts are known (out of 5872 products).
| Nutrition facts | As sold for 100 g / 100 ml |
Standard deviation | Minimum | 10th centile | Median | 90th centile | Maximum |
|---|---|---|---|---|---|---|---|
| Energy |
936 kj (224 kcal) |
259 kj (62 kcal) |
0 kj (0 kcal) |
417 kj (100 kcal) |
1,000 kj (240 kcal) |
1,260 kj (300 kcal) |
4,640 kj (1110 kcal) |
| Fat | 6.45 g | 2.71 g | 0 g | 2.4 g | 6.3 g | 11 g | 100 g |
| Saturated fat | 2.54 g | 1.47 g | 0 g | 0.6 g | 2.4 g | 5.36 g | 50 g |
| Monounsaturated fat | 1.22 g | 0.345 g | 0 g | 0.45 g | 1.25 g | 1.76 g | 2.7 g |
| Polyunsaturated fat | 0.328 g | 0.181 g | 0 g | 0 g | 0.39 g | 0.7 g | 2.9 g |
| Trans fat | 0 g | 0.003 g | 0 g | 0 g | 0 g | 0 g | 0.51 g |
| Cholesterol | 26 mg | 19.8 mg | 0 mg | 4 mg | 25 mg | 62 mg | 98 mg |
| Carbohydrates | 30.6 g | 10.2 g | 0 g | 12.7 g | 31.9 g | 46 g | 81.8 g |
| Sugars | 2.63 g | 1.35 g | 0 g | 0.9 g | 2.3 g | 5.2 g | 72 g |
| Added sugars | 0.586 g | 1.09 g | 0 g | 0 g | 0 g | 3.33 g | 5.05 g |
| Fiber | 2.17 g | 0.94 g | 0 g | 1 g | 2 g | 3.92 g | 48 g |
| Proteins | 8.86 g | 2.74 g | 0 g | 3.8 g | 9.2 g | 13 g | 70 g |
| Salt | 1.07 g | 0.308 g | 0 g | 0.6 g | 1 g | 1.6 g | 880 g |
| Alcohol | 0 % vol | 0 % vol | 0 % vol | 0 % vol | 0 % vol | 0 % vol | 0 % vol |
| Vitamin A | 94.6 µg | 127 µg | 0 µg | 15 µg | 48.8 µg | 372 µg | 3,180 µg |
| Vitamin D | 0.063 µg | 0.137 µg | 0 µg | 0 µg | 0 µg | 0.556 µg | 282 µg |
| Vitamin C (ascorbic acid) | 0.783 mg | 1.14 mg | 0 mg | 0 mg | 0 mg | 3.53 mg | 21.2 mg |
| Vitamin B1 (Thiamin) | 27.1 mg | 88.3 mg | 0 mg | 0.182 mg | 0.37 mg | 320 mg | 41,200 mg |
| Vitamin B2 (Riboflavin) | 0.233 mg | 0.08 mg | 0 mg | 0.2 mg | 0.26 mg | 0.28 mg | 290 mg |
| Vitamin B9 (Folic acid) | 233 µg | 44.6 µg | 70 µg | 212 µg | 246 µg | 256 µg | 256 µg |
| Potassium | 199 mg | 87.6 mg | 25 mg | 100 mg | 171 mg | 354 mg | 4,880 mg |
| Calcium | 70.4 mg | 49.5 mg | 0 mg | 8 mg | 70 mg | 150 mg | 504 mg |
| Iron | 1.28 mg | 0.526 mg | 0 mg | 0.64 mg | 1.12 mg | 2.22 mg | 400 mg |
| Fruits‚ vegetables‚ nuts and rapeseed‚ walnut and olive oils | 8.29 % | 10.1 % | 0 % | 0 % | 5 % | 31 % | 58 % |
| Fruits‚ vegetables and nuts - dried | 1.76 % | 3.1 % | 0 % | 0 % | 0 % | 8.9 % | 10.2 % |
| Fruits‚ vegetables‚ nuts and rapeseed‚ walnut and olive oils (manual estimate from ingredients list) | 19 % | 8.84 % | 2 % | 4.9 % | 19.7 % | 34.2 % | 50 % |
5,858 products
-
Tortellini - Müller - 250 g
-
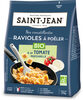
Pâtes fraiches farcies aux tomates confites et romarin - Saint jean - 250 g

-
Pâtes fraîches poivrons grillés - Saint jean - 250 g
-
Pâtes fraîches aux Aubergines et Huile d'olive Biologiques - Saint jean - 250 g

-

-
Tortellini à la viande

-
-
Pâtes fraîches au Comté AOP 12 mois d'affinage - Saint jean - 250 g

-
Pates fraîches Champignons poêlés & Ail des ours Biologiques - Saint jean - 250 g
-
Pâtes fraîches au fromage Boursin® Ail et fines herbes - Saint jean - 250 g

-
-
spinach & ricotta girasoli - Lidl
-
Gyoza Beef Bulgogi - Bibigo - 1kg
-
Ravioles à poêler au chèvre affiné ciboulette - Saint Jean - 310 g
-
Ravioli Ricotta e Spinaci - Picnic - 250 g
-
Ravioli z ricottą i suszonymi pomidorami - Taverna fell ancora

-
Ravioles artisanales au bleu du Vercors-Sassenage AOP surgelées - Maison Rambert - 1 kg

-
Ravioli bœuf - Carrefour - 300 g

-
Ravioli boeuf - Carrefour - 500 g
-
Pierogi ruskie - Szamamm
-
Pierogi ruskie ze smażoną cebulką - Szamamm - 320g

-
Girasoli - 3 fromages - Panzani
-
tortellini with cabbage and mushrooms - Anita - 750g

-
-
Cappelletti con prosciutto crudo - Nonna Mia - 500 g

-
Tortellini z ricottą i szpinakiem - Rana - 440 g

-
Ricotta & Spinazie ravioli - Jumbo

-
Ravioli ricotta et épinards
-
cappelletti freschi prosciutto crudo - Selex - 250 g
-
Tortellini al formaggio z dodatkiem serów - GustoBello - 250 g

-
-
Ravioli boeuf bolognaise - Lustucru

-
-
Buffalo milk ricotta & greens cappellacci - Unearthed

-
Pierogi z serem i jagodami - Kaufland

-
Tortellini ricotta épinards - Rana

-
Aldi Tortellini
-
Girasoli Au Homard -

-
Ravioli Tomate-Käse - Bio primo - 250 g
-
Ravioli au poulet
-
Pierogi z serem - Auchan - 500g
-
240 g
-
Mushroom Ravioli - Albert Heijn
-
Ravioli jambon cuit -
-
Ravioli à l'indienne poulet curry - Carrefour - 250 g
-
Gyozas poulet

-
Raviolis Cèpes & Parmesan - Lustucru - Quantité non spécifié / Poids 250gr

-
8 gyoza grillés aux légumes - Deli's World - 180 g
-

-
Tortelloni - Spar

-
2 x 250 g
-
Ravioli Boeuf & Petits Oignons - Toque du Chef - 300 g
-
Ravioles à poêler chèvre - Lustucru
-
Tortellini Ricotta épinards - Bennati

-
Tortelini pomidory + bazylia -
-
Tortellini szpinak + czosnek -

-
Tortellini grzyby
-
Tortellini - Toque du chef
-
Tortellini Champignon
-
TORTELLINI Pizzaiola Cheese & Tomato - Pagani
-
Tortellini Potiron Champignons - Bennati - 250 g

-
Spinat Cappelletti - Rewe
-
Ravioli canard -
-
Girasole ricotta epinard
-
Tortelloni Ricotta & Spinat - Hammer Mühle - 1pcs
-
Giradole chèvre miel - Lidl

-
spinach & ricotta tortellini - cucina

-
Ravioli Tomates Confites Romarin - Comptoir du Pastier - 250 g
-
Quadrucci ripieni - Coop - 250 g
-
vegane Ravioli mit Schmelzfüllung - dmBio - 250g

-
Tortelli con gorgonzola e noci - Tigros - 250 g
-
Ravioles BIO à poêler à la Tomate Mozzarelle 310g - Saint jean - 310 g
-
Beef ravioli - Heinz

-
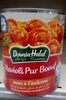
Ravioli pour bœuf - Dounia Halal
-
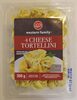
4 Cheese Tortellini - Western Family - 350 g
-
Girasoli au Saumon Fumé - Amor Di Pasta - 250 g
-
Spinach and ricotta ravioli - WW
-
Butternut Squash Agnolotti - Western Family - 300 g
-
Cannelloni bœuf et porc - Leaderprice
-
750 g

-
Braised Beef & Red Wine Ravioli - Rana - 250g

-
Heinz
-
tortellini - Pam's - 300g
-
tagliolini con tartufo nero - Bennati - 250 g
-
Ravioles au Beaufort

-
Tortellini Formaggio - Albert Heijn
-
Ravioli - Boni
-
Ravioli Napoli - Migros Bio - 435 g
-
Ravioli aux cèpes - Lidl - 250 g ℮

-
Luigi fratelli

-
Pierogi ruskie ze smażoną cebulką - Szam amm - 320 g

-
Raviolis aux girolles - 300 g

-
Ravioli au boeuf - La Rusticosa - 500 g

-
Cannelloni ricotta épinards sauce tomate - Comme j'aime
-
Gemüse Ravioli in Tomatensauce - dmBio - 270g
-
Wegańskie pierogi à la mięsne - HAPPY VEGE - 300 g

-
Pierogi roślinne z tofu naturalnym i pastą szpinakową - PlantEver - 230 g
-
Tridelli pierożki warzywne z batatami i dynią bio - Soto - 180 g

-
Canelones assumpta fontseca

-
Pierogi z grzybami leśnymi - Deluxe - 400 g
