Toasts
Belongs to:
Breads, Cereals and potatoes, Plant-based foods, Plant-based foods and beverages
Contains:
Nutrition facts
Average nutrition facts for the 1368 products of the Toasts category for which nutrition facts are known (out of 1455 products).
| Nutrition facts | As sold for 100 g / 100 ml |
Standard deviation | Minimum | 10th centile | Median | 90th centile | Maximum |
|---|---|---|---|---|---|---|---|
| Energy |
1,520 kj (362 kcal) |
270 kj (64 kcal) |
2 kj (0 kcal) |
1,050 kj (249 kcal) |
1,630 kj (388 kcal) |
1,810 kj (431 kcal) |
2,630 kj (1110 kcal) |
| Fat | 6.8 g | 3.46 g | 0 g | 2.6 g | 6.2 g | 13 g | 53.7 g |
| Saturated fat | 1.33 g | 1.06 g | 0 g | 0.4 g | 0.9 g | 3.6 g | 31.6 g |
| Monounsaturated fat | 2.67 g | 1.86 g | 0 g | 0.4 g | 2.5 g | 6 g | 16.7 g |
| Polyunsaturated fat | 1.51 g | 0.949 g | 0 g | 0.1 g | 1.45 g | 3.33 g | 12.2 g |
| Trans fat | 0 g | 0 g | 0 g | 0 g | 0 g | 0 g | 0.032 g |
| Cholesterol | 0.062 mg | 0.348 mg | 0 mg | 0 mg | 0 mg | 0 mg | 11 mg |
| Carbohydrates | 60.6 g | 11.2 g | 0.8 g | 41 g | 65 g | 73 g | 86.7 g |
| Sugars | 4.58 g | 2.18 g | 0 g | 1.8 g | 4.1 g | 8.89 g | 74 g |
| Starch | 62.9 g | 3.81 g | 55 g | 58 g | 62.5 g | 73.7 g | 73.7 g |
| Fiber | 5.56 g | 2.28 g | 0 g | 2.61 g | 5.1 g | 10 g | 67 g |
| Proteins | 10.7 g | 1.89 g | 1 g | 8 g | 11 g | 14 g | 50 g |
| Salt | 1.21 g | 0.296 g | 0 g | 0.77 g | 1.2 g | 1.7 g | 35.9 g |
| Alcohol | 0 % vol | 0 % vol | 0 % vol | 0 % vol | 0 % vol | 0 % vol | 0 % vol |
| Vitamin A | 2.76 µg | 8.61 µg | 0 µg | 0 µg | 0 µg | 30 µg | 1,500 µg |
| Vitamin B1 (Thiamin) | 3,530 mg | 7,170 mg | 0.096 mg | 0.096 mg | 0.76 mg | 100,000 mg | 100,000 mg |
| Vitamin B9 (Folic acid) | 66.5 µg | 37.6 µg | 16 µg | 24 µg | 68 µg | 133 µg | 400 µg |
| Calcium | 105 mg | 82.6 mg | 0 mg | 0 mg | 83 mg | 250 mg | 360 mg |
| Phosphorus | 166 mg | 91.6 mg | 40 mg | 50 mg | 200 mg | 300 mg | 320 mg |
| Iron | 3.11 mg | 1.96 mg | 0 mg | 0.72 mg | 3 mg | 7.5 mg | 6,430 mg |
| Magnesium | 74.2 mg | 30.3 mg | 8 mg | 24 mg | 80 mg | 113 mg | 140 mg |
| Fruits‚ vegetables‚ nuts and rapeseed‚ walnut and olive oils | 0 % | 0 % | 0 % | 0 % | 0 % | 0 % | 31.9 % |
| Fruits‚ vegetables and nuts - dried | 0 % | 0 % | 0 % | 0 % | 0 % | 0 % | 0 % |
1,452 products
-
Crisp toasts - Jacob's - 100 g

-
Mehrkorntoast - Ölz - 250g
-
60 Mini Biscotes de trigo - Diatosta - 120 g
-
Toast Brötchen Dinkel - Goldähren - 335g

-
Chia and flaxseed Wraps - Prozis - 420 g (6 x 70 g)
-
Sandwichtoast Saatenharmonie - Goldähren - 375 g
-
Krisprolls Dorés - 240 g
-
Marinheiras sem Sal - Cem Porcento - 200 g

-
Multigrain Melba toast - Sainsbury's
-
Körner Harmonie Sandwich - Golden Toast - 750g
-
Biscottes naturel - Albert Heijn
-
Soepstengels sesam - Albert Heijn

-
Knoflook luxe toastjes - Backers - 185 g

-
Croûtons grillés saveur herbes et ail spécial salade - Auchan - 0.06 kg
-
Petits pains grillés sans sucres ajoutés - Riches en Fibres - Sélection Intermarché - 225g
-
Pão Tostado - El Horno - 405 g (3 x 135 g)
-
Kleiner Sandwichtoast - Dinkel - Goldähren - 375 g
-
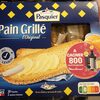
Pain Grillé l'Original - BRIOCHE PASQUIER - 415 g
-
Petits Pains Grillés Complet sans sucres ajoutés biologique - Auchan - 0.225 kg
-
Toast rond seigle fruit de mer - Auchan - 0.3 kg
-
Petits Pains Grillés céréales et graines biologique - Auchan Bio - 0.225 kg
-
Krisprolls - 425 g
-
Tostas Sementes - Gut Bio - 200 g

-
Pain grillé tomate & origan - Sol & Mar
-
Buttertoast - Goldähren - 500 g
-
Pan tostado proteínas - Mas Protein - 200 g

-
Biologische melba toast - Albert Heijn

-
Vollkorn Toast - Golden Toast - 500g

-
Toast pain - M-Budget - 560g
-
Grilletine Briochée x18 - Brioche Pasquier - 255 g
-
Traditionele toast - Jos Poell - 50 g
-
American Sandwich Vollkorn - Mike Mitchell's - 750 g

-
Toastbrot Sammys - Harry - 750g
-
Panecillos tostados 100% integral de trigo - Carrefour

-
Snack cups - Haust
-
Grahamskex - Haust

-
Snack Cups - Haust
-
Toast'n chips - Haust

-
Toast 'N Chips Tomaat Basilicum - Haust
-
Snack cups - Haust - 130 g
-
Star cups - Haust - 100 g

-
Mini toast naturel - Haust - 80 g
-
Brot Vollkorn Toast - ja! - 500g
-
Tortitas de Arroz Integral com Sal - Continente - 130 g
-
Dvopek iz cijelig zrna - Klara - 225 g

-
Sandwich Scheiben (Dinkel) (Toast) - American Style - 375 g

-
Petits Pains Grillés - Leader Price
-
Toast - Denner - 560g
-
Tostas de trigo - Tostagrill - 300 g
-
Finn Toastbrötchen - Rewe - 4pcs

-
Toast Dunkel Geschnitten - Prix Garantie

-
Dvppek classic - Klara - 225g
-
Tosta De Trigo Integral Com Aveia E Sementes - Continente - 150 g
-
Garlic bread - BECKY'S - 150 g
-
Krisprolls Wholegrain - Pågen - 400g
-
Pain lait bio* far complet x8 280g - Bien - 280 g

-
Krisprolls - Pagen - 240g

-
Sandwich-Scheiben - Weizen - American Style - 375 g

-
Wholegrain - Pågen - 225g

-
Petit Pains grillés - Mannapain - 225 g

-
White Vienna Style Crusty Rolls - Sainsbury's

-
Dinkel Sandwich - Harry - 375 g

-
Petits Pains Grillés complet sans sucres ajoutés* - Auchan - 0.225 kg
-
Eiweiß Toastbrötchen - Harry
-
Mediterrane Toast, Toast mit mediterranen Kräutern - delicieux - 130g
-
Pain grillé à la farine complète BIO - Auchan Bio - 0.25 kg

-
Tostowy pszennych dan cake

-
Sandwichtoast - K-Bio - 375 g
-
Sandwichscheiben - Weizen - American Style - 750 g

-
Melba toast naturel - Van der Meulen - 120g
-
Lot de 2 toasts nature te - Harrys - 500 g
-
Toast seigle te - Harrys - 250 g

-
Melba toast sesam - Van der Meulen - 120 g
-
Dinkel harmonie - GOLDEN Toast - 750g

-
Toast - Mike Mitchell's - 750g

-
Bakkersbeschuit Volkoren - Van der Meulen - 125 g

-
Tostadas de Maíz - Susanita - 100 g
-
Vollkorn complet - Migros - 10 x 28g

-
Petits Pains Grillés au Blé complet - Cora - 400 g
-
Melba Toast -
-
Miller's Toast Fig & Sultana - 100g
-
Mini Tostas Integrais - Continente - 180 g

-
Pãezinhos Tostados Azeite, Alho & Salsa - Pingo Doce - 160 g
-
Petits pains suédois krisprolls - Pagen ab - 400 g
-
Toastbrot - Kornmühle - 500g

-
Braised rusks Wholemeal Wheat - Carrefour - 270 g

-
Hacendado - 250 g
-
Krisprolls Complets - 425g

-
Pan tostado proteínas - Hacendado - 200 g
-
Toast pain de mie - - 500g

-
Bio Tostada Crujientes Tomate - Santiveri - 100 g
-
Bocaditos snatts - Snatt's - 110g
-
Petits pains grillés - Borsa
-
Mini toasts grillés
-
Noglut Crispy Break Cacao - Santiveri - 100 g
-
Noglut Crispy Break Coco - Santiveri - 130 g
-
Mini tostadas de trigo extra finas - Minigrill - 100 g
-
Petits Pains Grillés Froment - Auchan - 0.225 kg

-
Apéri toasts grillés sésame - Auchan - 0.1 kg

-
Petits pains grillés au blé complet - Auchan - 400 g