Vegetable-based beverages - Page 4
Belongs to:
Vegetable-based foods and beverages, Plant-based beverages, Beverages, Plant-based foods and beverages, Beverages and beverages preparations
Contains:
Nutrition facts
Average nutrition facts for the 1098 products of the Vegetable-based beverages category for which nutrition facts are known (out of 1168 products).
| Nutrition facts | As sold for 100 g / 100 ml |
Standard deviation | Minimum | 10th centile | Median | 90th centile | Maximum |
|---|---|---|---|---|---|---|---|
| Energy |
107 kj (26 kcal) |
36 kj (9 kcal) |
4 kj (1 kcal) |
67 kj (16 kcal) |
93.6 kj (22 kcal) |
176 kj (42 kcal) |
1,640 kj (391 kcal) |
| Fat | 0.178 g | 0.213 g | 0 g | 0 g | 0.1 g | 0.5 g | 63 g |
| Saturated fat | 0.034 g | 0.046 g | 0 g | 0 g | 0 g | 0.1 g | 4 g |
| Trans fat | 0 g | 0 g | 0 g | 0 g | 0 g | 0 g | 0 g |
| Cholesterol | 0 mg | 0 mg | 0 mg | 0 mg | 0 mg | 0 mg | 0 mg |
| Carbohydrates | 5.22 g | 2.19 g | 0.1 g | 2.8 g | 4.4 g | 9.4 g | 87 g |
| Sugars | 4.5 g | 2.01 g | 0 g | 2.5 g | 3.5 g | 8.1 g | 24 g |
| Fiber | 0.623 g | 0.409 g | 0 g | 0 g | 0.6 g | 1.2 g | 6 g |
| Proteins | 0.713 g | 0.221 g | 0 g | 0.32 g | 0.8 g | 1 g | 16 g |
| Salt | 0.329 g | 0.249 g | 0 g | 0.004 g | 0.3 g | 0.7 g | 3.5 g |
| Alcohol | 0 % vol | 0 % vol | 0 % vol | 0 % vol | 0 % vol | 0 % vol | 0 % vol |
| Vitamin A | 390 µg | 451 µg | 0 µg | 62.4 µg | 125 µg | 1,430 µg | 4,370,000,000 µg |
| Vitamin E | 3.02 mg | 1.79 mg | 0.05 mg | 1.05 mg | 3 mg | 6 mg | 9 mg |
| Vitamin C (ascorbic acid) | 24.3 mg | 11.9 mg | 0 mg | 2.5 mg | 30 mg | 45 mg | 72,000 mg |
| Vitamin B1 (Thiamin) | 109 mg | 298 mg | 0 mg | 0 mg | 0.12 mg | 1,000 mg | 33,300 mg |
| Vitamin B2 (Riboflavin) | 0.083 mg | 0.084 mg | 0 mg | 0 mg | 0.071 mg | 0.21 mg | 70.8 mg |
| Potassium | 215 mg | 61.1 mg | 58 mg | 158 mg | 200 mg | 340 mg | 618 mg |
| Calcium | 10.7 mg | 6.59 mg | 0 mg | 6.67 mg | 8 mg | 25 mg | 40,000 mg |
| Iron | 0.351 mg | 0.238 mg | 0 mg | 0.15 mg | 0.3 mg | 0.951 mg | 720 mg |
| Fruits‚ vegetables‚ nuts and rapeseed‚ walnut and olive oils | 93.4 % | 17.6 % | 30 % | 40 % | 100 % | 100 % | 100 % |
| Fruits‚ vegetables‚ nuts and rapeseed‚ walnut and olive oils (manual estimate from ingredients list) | 93.7 % | 14.8 % | 47 % | 95 % | 99 % | 100 % | 100 % |
1,169 products
-
Tesco 100% pressed tomato juice

-
Fortuna - 300 ml
-
tomato juice - sainbury
-
Sok marchwiowy - Cymes

-
Нектар "Томат" - Моя цена - 0,93 л

-
СОК ОТ МОРКОВИ - K-Bio - 500 ml

-
Сок томатный - Global Village
-
Original 100% Vegetable Juice - V8 - 6 x 5.5 fl oz

-
tomatensaft - EnerBio - 0.5l
-
Fermented Sauerkraut Juice - Loving Foods - 250 mL

-
Salgam Suyu - Yeni Kavaklıdere - 250 ml

-
Sok marchew - Vital Fresh - 330 ml

-
Jus de tomate BIO au piment d'Espelette - OSTIA - 75 cl

-
Доматен сок от концентрат - K Classic - 1 l

-
10 vegetable cocktail - Oasis

-
Energy - Black Cherry - V8 - 237 ml
-
Kaufland
-
Fancy Tomato Juice - Bountiful Harvest - 46 fl oz
-
Sok marchew banan - Vital - 330ml

-
Tomato Juice -

-
Sok 100% pomidorowo-warzywny - Riviva - 300 ml

-
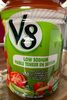
Low Sodium V8 - 1.89 l
-
Jus de tomate -

-
Tomato juice - Cido - 1.5l

-
Sok wielowarzywny - Dawtona - 300 ml

-
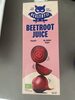
Beetroot Juice - HealthyCo - 1liter
-
Sok 100% pomidor zioła włoskie - Fortuna - 300 ml
-
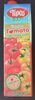
Double tomato - Tipco - 1 L
-
Pur jus de tomate - Naturalia - 75 cl

-
Bio Karottensaft - Nature Pur - 750ml

-
Gerettete Bio Karotte Saft - Rettenswert - 0,5 l

-
-
Sok kiszony burak vega - Tymbark - 250 ml

-
Sok Pomidor - Riviva - 1l
-
Jus de carotte - Jean-Louis Bissardon

-
Jus de Betterave - Léa Nature Jardin Bio - 778.3 ml
-
V8 Low Sodium Vegetable Cocktail - 1.89 l
-
Direktsaft Karotte - Hipp - 330 ml
-
Jus de tomates - U
-
Karotten Saft - ener bio - 500ml
-
Jus de tomate -
-
Jus de tomate - Juver
-
Jus de tomate - Cal Valls

-
Sok pomidorowy - Paquito

-
Tymbark gruszka pietruszka - 250 ml
-
Karottensaft - Kaufland - 500 ml

-
Pur jus de carotte lactofermenté bio - Vitamont - 75 cl
-
Carrot Juice with Honey - Solevita - 330 ml

-
Super Celery Vegetable Juice - Arden's Garden - 15.2 oz

-
Karottensaft mit Honig - Frucht Stern - 0,5L
-
Solevita - 500 ml
-
Cocktail De Légumes (10 Légumes) - Oasis - 960ml
-
Karotten Saft - grünfink - 1000 ml

-
Karottensaft - GO BIO - 1l

-
Tomatensaft - Classic - 1l

-
OWOLOVO - 750 ml
-
KEAN Tomato Juice 250ml
-
RHABARBER Nektar - K-Classic - 1 l

-
Karottensaft - Naturwert - 1l

-
Bio-Karottensaft - Naturgut - 1l

-
Tomato juice - Baresa (Lidl) - 500g

-
British Carrot Juice - James White

-
Möhren Saft - Edeka - 0,5 L
-
Sok 100% pomidor - Fortuna - 1 l

-
Zumo de Zanahoria - Beutelsbacher

-
Sangrita Classic - 0.5 l

-
Tomaten Gemüsesaft - Paradiso - 1L
-
Ingwer Kurkuma 7 Tage Shot -

-
Le plein de légumes pour la journée - Kagome - 1l
-
Jus de tomate - Cidou

-
Tomato Juice
-
Rice - Joya - 1 l

-
tomaat groentesap - Gwoon

-
Premium karottensaft - Kaufland Favourites - 500 ml
-
Manzana remolacha y goui - Solevita
-
Jus de tomates - Granini

-
Rote Bete Saft - Edeka Bio

-
TIPCO - 1 l
-
Groentje - Schulp
-
Jus de tomate - Terre Equitable
-
Jus de carottes - Voelkel

-
Karottensaft - Rio d'oro
-
Acetoplus carotte - Wiberg

-
Organic carrot juice - Trader Joe's
-
Jus de tomate - Rauch - 20cl
-
Pur jus de tomate

-
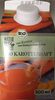
BIO Karottensaft - naturgut penny - 500 ml
-
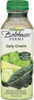
Fruit & vegetable juice daily greens - Bolthouse farms - 450 ml (15.2 fl. oz.)
-
Spiced Tomato Juice - Marks & Spencer

-
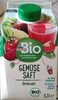
Gemüsesaft - DM Bio - 0,5 L
-
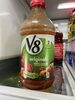
V8 100% vegetable juice
-
Jus de Carotte - Biotta

-
Jus De Carotte 20CL bio - Vitamont - 20 cl
-
Pur Jus bio tomate - Jus de Rêve

-
Fortuna - 1 l
-
Marks & Spencer - 750 ml e

-
Jus de légumes - Luna e Terra
-
Jus De Betterave France - Natur' Avenir

-
Aloe Vera à boire - esprit bio - 500 ml
-
Jus betteraves rouges - Boots - 500 ml