Poultry meals
Belongs to:
Contains:
Nutrition facts
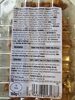
Average nutrition facts for the 4678 products of the Poultry meals category for which nutrition facts are known (out of 5047 products).
| Nutrition facts | As sold for 100 g / 100 ml |
Standard deviation | Minimum | 10th centile | Median | 90th centile | Maximum |
|---|---|---|---|---|---|---|---|
| Energy |
670 kj (161 kcal) |
239 kj (59 kcal) |
0 kj (0 kcal) |
406 kj (96 kcal) |
607 kj (145 kcal) |
1,210 kj (297 kcal) |
5,790 kj (1380 kcal) |
| Fat | 7.53 g | 5.18 g | 0 g | 2.3 g | 6 g | 18 g | 73.7 g |
| Saturated fat | 2.34 g | 1.87 g | 0 g | 0.5 g | 1.8 g | 6.3 g | 39.8 g |
| Monounsaturated fat | 2.47 g | 1.35 g | 0.001 g | 0.39 g | 2.8 g | 4.5 g | 6.4 g |
| Polyunsaturated fat | 1.82 g | 0.898 g | 0.029 g | 0.59 g | 1.9 g | 3.6 g | 7.69 g |
| Trans fat | 0.033 g | 0.061 g | 0 g | 0 g | 0 g | 0.2 g | 0.5 g |
| Cholesterol | 20.8 mg | 12.4 mg | 0 mg | 5.88 mg | 16 mg | 46.4 mg | 104 mg |
| Carbohydrates | 11.1 g | 6.23 g | 0 g | 1.3 g | 11.2 g | 21 g | 82.5 g |
| Sugars | 1.72 g | 1.14 g | 0 g | 0.41 g | 1.5 g | 3.9 g | 65 g |
| Starch | 8.87 g | 2.5 g | 3.6 g | 3.6 g | 9.7 g | 17 g | 17 g |
| Fiber | 1.33 g | 0.745 g | 0 g | 0 g | 1.2 g | 2.8 g | 24 g |
| Proteins | 9.64 g | 4.17 g | 0 g | 5.3 g | 8.2 g | 19 g | 62 g |
| Salt | 0.888 g | 0.342 g | 0 g | 0.43 g | 0.8 g | 1.51 g | 27.7 g |
| Alcohol | 0 % vol | 0 % vol | 0 % vol | 0 % vol | 0 % vol | 0 % vol | 0.1 % vol |
| Vitamin A | 101 µg | 130 µg | 0 µg | 0 µg | 64.2 µg | 477 µg | 16,900,000 µg |
| Vitamin C (ascorbic acid) | 5.1 mg | 4.77 mg | 0 mg | 0.5 mg | 2.6 mg | 17 mg | 43.2 mg |
| Vitamin B1 (Thiamin) | 248 mg | 557 mg | 0 mg | 0 mg | 0.027 mg | 1,670 mg | 6,980 mg |
| Vitamin B2 (Riboflavin) | 0.052 mg | 0.072 mg | 0 mg | 0 mg | 0.024 mg | 0.283 mg | 23.1 mg |
| Potassium | 168 mg | 60.2 mg | 40 mg | 92 mg | 161 mg | 378 mg | 730 mg |
| Calcium | 28.5 mg | 25.8 mg | 0 mg | 7.41 mg | 20 mg | 104 mg | 22,500 mg |
| Iron | 0.762 mg | 0.553 mg | 0 mg | 0.267 mg | 0.596 mg | 2.32 mg | 607 mg |
| Fruits‚ vegetables‚ nuts and rapeseed‚ walnut and olive oils | 15.6 % | 12.8 % | 0 % | 0 % | 15 % | 37 % | 61.9 % |
| Fruits‚ vegetables and nuts - dried | 0.765 % | 1.61 % | 0 % | 0 % | 0 % | 5.3 % | 25 % |
| Fruits‚ vegetables‚ nuts and rapeseed‚ walnut and olive oils (manual estimate from ingredients list) | 19.5 % | 10.2 % | 0 % | 4.5 % | 19 % | 36 % | 59 % |
5,043 products
-

-
GA Bun Volaille - Papylee - 350 g
-
Bapao pittige kip - Albert Heijn

-
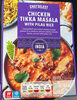
Chicken Tikka Masala - Fuel'd Foods - 400g

-
Mini Bao poulet - 1.0 kg

-
Crunchy Chicken and Dumplings - Deli Fresh - 350 g
-
Miniloempia kip - Gwoon - 300 g
-
Fackelbrot Chicken Teriyaki - Bard - 0,230 kg

-
Ramen au poulet - Fresh Mood - 250 g
-
Asian Salad Poulet Gingembre - Sodebo

-
Poulet émincé à la normande - Marie - 300g

-
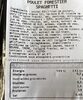
Fusilli au poulet - Fleury Michon - 280 g

-
Parmentier de canard - Picard - 1 350 g
-
LA salade poulet konjac
-
blackened chicken with mango salsa - Redefine
-
Parmentier de canard - 300 g

-
Haut de cuisse de poulet grillé, pdt grenaille et HV à l'ail -

-
Japchae au poulet - Picard - 350 g

-
Cassoulet tradition au confit de canard - Les Garibotes

-
Chicken Tikka Masala - Chef Select - 400 g
-
Poulet curry

-
Chicken Pasta - Fit Foods - 400 g

-
-
Butter Chicken - Goldspoon

-
160 g
-
Risotto aux cèpes et poulet - Lechef - 280 g
-
Poulet yassa olive
-
Tabouleh Rice & Grilled Chicken - Factor

-
Linguine sauce Alfredo au poulet -
-
Herb-Crusted Chicken - Factor

-
Émincé de poulet, Conchi, Gy complète et légumes à l’italienne - Picard - 350 g

-
Risotto confit de canard et cèpes - Maison Montfort - 320 g
-
Kipragout - Albert Heijn - 400 g

-
Pulled chicken met barbecussaus - Jumbo - 185 g

-
Kyckling Jacob - Dafgårds
-
Yakatori poulet - Monoprix - 250 g

-

-
Couscous poulet
-
Poulet au curry et son riz - Comme j’aime

-
Шницель рубленый - Ярославский Бройлер - 0,480 кг
-
Poulet basquaise & piment d'Espelette - Etxe Peio - 750 g

-
Kipfilet Mexican style - Musclemeat
-
Work de poulet aux légumes et riz rond - Les Halles solanid - 350 g
-
Confit de canard
-
Chicken Biryani - Royal - 400g

-
Oven Fried Chicken with Mashed Potatoes - Lean Cuisine - 297 g

-
Peri Peri Chicken - E2M Kitchen

-
Chicken tikka masala

-
Poulet yassa et riz basmati - 300 g

-
émincé de poulet - Dietbon - 300 g

-
TORTILLA WRAP POULET - PAPYLEE - 300g
-
8 nems au poulet - Toque du Chef - 560 g
-
Nems poulet - Betty bossi
-
Satay chicken

-
Poulet shawarma - Fresh - 320 g

-
Chef Select - 380 g
-
Kyckling Curry - Smaka - 235 g
-
Thai inspired green chicken curry - Sainsbury
-
Confit de canard

-
Marks & Spencer
-
300 g
-
Poulet chow mein - 320 g
-
butterchicken - cuisune - 375 g
-
Butter chicken and rice - Macros

-
Poulet forestier spaghetti - Leclerc
-
Kipfilet doperwten en wortel - Albert Heijn - 500 g

-
Kurczak curry po indyjsku - So Food - 330 g
-
Cassoulet au confit de canard - Pays Gourmand
-
-
Poulet braisé sauce saté -
-
Chicken Tikka Masala - Rainbow
-

-
British Coronation Chicken Slices - M&S - 120g
-
Tesco
-
Tesco
-
GSN breaded chicken katsu curry - 350g
-
Parmentier de poulet - - 750 g
-
Poulet forestier spaghetti - Leclerc
-
Poularde farcie

-
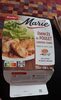
Émincés de poulet purée de petit pois - Marie - 300 g
-
Gebratene Nudeln Bami Goreng Style - Kania - 125g

-
Fleischschnacka de volaille - Chez Élodie - 338 g
-
Cuisses de canard confites -
-
Volaille Sauce Automnale - Clos Saint Sozy
-
Moelleux de chapon braisé et crémé sauce aux morilles - Jean Larnaudie - 250 g

-
Coffret Salade crudités Poulet Fromage & Oeuf Conchiglie +1 mini quatre-quarts + sauce vinaigrette au vinaigre balsamique - Lidl - 320 g
-
boudin blanc au faisan et aux champignons forestiers - Saveurs Forestières - 300 g

-
Meli mélo de canard aux épices de Noël

-
Coq au vin

-
Peruvian Style Chicken Curry with Coriander Rice - ASDA Meal For One - 400g
-
Butter Chicken - Tesco - 400g
-
Chicken Dhansak - Teaco - 400g
-
Poulet basquaise - Agis

-
Kanalastuja, paasta ja tomattipestokasviksia - Kokkikartano - 360 g
-
Butter Chicken - Waitrose
-
Chicken Korma - Lidl

-
Poularde farcie - Deluxe

-
Boulgour volaille butternut - Croquez bio - 300 g
-
Cuisse de poulet Yassa - Seazon
-
Tomato and Basil Chicken - Tesco - 380g
