Breaded products - Page 33
Contains:
- Breaded Bami patties
- Breaded cheeses
- Breaded chicken
- Breaded cutlets substitutes
- Breaded fish
- Breaded fish substitutes
- Breaded meat cutlets
- Breaded turkey
- Breaded vegetable patties
- Cheese and ham breaded
- Chicken kievs
- Chicken kievs substitutes
- Cordons bleus
- Kroketten
- Poultry nuggets
- Vegetarian cordons bleus
- Vegetarian nuggets
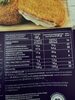
Nutrition facts
Average nutrition facts for the 5906 products of the Breaded products category for which nutrition facts are known (out of 6266 products).
| Nutrition facts | As sold for 100 g / 100 ml |
Standard deviation | Minimum | 10th centile | Median | 90th centile | Maximum |
|---|---|---|---|---|---|---|---|
| Energy |
890 kj (213 kcal) |
162 kj (39 kcal) |
0 kj (0 kcal) |
582 kj (139 kcal) |
895 kj (214 kcal) |
1,150 kj (274 kcal) |
4,020 kj (962 kcal) |
| Fat | 10.1 g | 3.78 g | 0 g | 2.9 g | 10 g | 16 g | 186 g |
| Saturated fat | 1.91 g | 1.3 g | 0 g | 0.53 g | 1.5 g | 4.5 g | 40 g |
| Monounsaturated fat | 3.97 g | 1.82 g | 0 g | 1.46 g | 4 g | 6.9 g | 8.3 g |
| Polyunsaturated fat | 4.24 g | 1.64 g | 0 g | 1.9 g | 4.46 g | 6.59 g | 8.6 g |
| Omega 3 fat | 392 mg | 417 mg | 0.183 mg | 98 mg | 206 mg | 1,500 mg | 130,000 mg |
| Trans fat | 0 g | 0.005 g | 0 g | 0 g | 0 g | 0 g | 8.33 g |
| Cholesterol | 33.4 mg | 11.9 mg | 0 mg | 15 mg | 35 mg | 54 mg | 106 mg |
| Carbohydrates | 15.8 g | 4.4 g | 0 g | 7.8 g | 16 g | 23 g | 171 g |
| Sugars | 1.33 g | 0.789 g | 0 g | 0.3 g | 1.2 g | 2.8 g | 40 g |
| Added sugars | 0.459 g | 0.564 g | 0 g | 0 g | 0 g | 1.19 g | 2.38 g |
| Fiber | 1.63 g | 1.16 g | 0 g | 0.4 g | 1.28 g | 4 g | 24 g |
| Proteins | 13.6 g | 3.04 g | 0 g | 9.2 g | 13 g | 19 g | 79 g |
| Salt | 1.12 g | 0.32 g | 0 g | 0.66 g | 1.1 g | 1.7 g | 1,600 g |
| Alcohol | 0 % vol | 0 % vol | 0 % vol | 0 % vol | 0 % vol | 0 % vol | 0 % vol |
| Vitamin A | 28.9 µg | 48.1 µg | 0 µg | 0 µg | 0 µg | 139 µg | 408,000,000 µg |
| Vitamin D | 0.472 µg | 1.15 µg | 0 µg | 0 µg | 0 µg | 3.9 µg | 6.7 µg |
| Vitamin C (ascorbic acid) | 0.324 mg | 0.679 mg | 0 mg | 0 mg | 0 mg | 1.6 mg | 10.7 mg |
| Vitamin B12 (cobalamin) | 7.95 µg | 51.1 µg | 0 µg | 0.38 µg | 0.59 µg | 2.7 µg | 780,000 µg |
| Potassium | 203 mg | 74.3 mg | 0 mg | 89 mg | 209 mg | 345 mg | 946 mg |
| Calcium | 96.6 mg | 147 mg | 0 mg | 0 mg | 24 mg | 405 mg | 911 mg |
| Iron | 1.13 mg | 0.687 mg | 0 mg | 0.002 mg | 1 mg | 2.22 mg | 720 mg |
| Selenium | 15 µg | 9.35 µg | 0 µg | 9.8 µg | 13 µg | 43.9 µg | 9,700,000 µg |
| Iodine | 1,330 µg | 4,700 µg | 34 µg | 44.7 µg | 59.4 µg | 7,500 µg | 59,300,000 µg |
| Fruits‚ vegetables‚ nuts and rapeseed‚ walnut and olive oils | 2.9 % | 4.38 % | 0 % | 0 % | 0 % | 13 % | 80 % |
| Fruits‚ vegetables‚ nuts and rapeseed‚ walnut and olive oils (manual estimate from ingredients list) | 34.1 % | 18.5 % | 5 % | 11.7 % | 33 % | 61 % | 84 % |
6,264 products
-
Kipleckere Nuggets - De Vegetarische Slager
-
Nuggets de saumon - L'assiette Bleue

-
Nuggets avec sauce ketchup - Delhaize - 220 g
-
Pané de Cabillaud Panure Bio - Assiette Bleue - 200 g
-
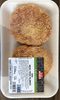
Croquettes de fromage - BizBiz - 240 g

-
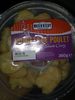
Nuggets de poulet - Migros - 750g
-
10 bastoncini con omega 3 - Findus - 250 g
-
Milanesa Mix Legumbres - Granja del Sol - 330 g

-
Cordon Bleu - 2 kg
-
Mon escalope milanaise - Royal Bernard

-
Cordon bleu de Poulet
-
Fish bar - Findus - 250 g
-
Migros Poulet Nuggets
-
Nuggets - Garden Gourmet - 200 g

-
Nuggets vegetariens - Garden Gourmet
-
Garden gourmet vegetarian cutlet - 180 g
-
Escalope de poulet panee -

-
Pechuga rellena de jamón ibérico - Calatayud

-
Vegane Fischstäbchen - Vehappy

-
Nuggets De Poulet panés - Yarden - 700 g
-
Cordon bleu - Nous anti-gaspi - 400 g
-
Cordons bleus de dinde - Thiriet - 400 g
-
Delicias de pollo - Preli - 500G

-
Nuggets de dinde Halal - Nous anti-gaspi - 400 g
-
Le Coeur Frais Pesto - 14 bâtonnets - Fleury Michon - 224 g
-
Languette de poulet - Zabiha Halal

-
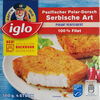
Pazifischer Polardorsch Serbische Art - Iglo - 300 g
-
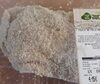
Pechuga - jucarne
-
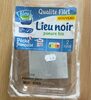
Lieu noir panure bio - BLEU VERT - 180 g
-
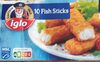
Fish sticks - Iglo
-
Crispy Chicken Fingers - foodworks
-
Breaded Katsu Chicken Breast Fillets - Iceland

-
Escalopes milanaises - Le Gaulois
-
Hähnchen Minischnitzel - Gour Meat - 500g
-
Le cordon bleu de poulet - - 4x125g
-
Escalope de veau milanaise, format familial -
-
50 pépites de poulet - Bien Vu! - 1 kg
-
Escalopes de poulet panées crues - Père Dodu
-
Pané aux céréales de filet de colin d'alaska - 500 g

-
Nuggets di tacchino e pollo
-
cordons-bleus de poulet - Qualité & Prix - 0,356 kg
-
Nuggets - AIA - 210 g

-
Sticks de poisson - Denner - 15pcs
-
Cordon bleu de dinde x2 - Les Eleveurs de la Charentonne
-
Cordon bleu de poulet bio -
-
Nasi Snack - Mora - 400 g

-
Crousti chicken nuggets
-
Escalopes de dinde marinées a la milanaise - Le Gaulois
-
Les milanaises - Le Gaulois
-
Garlic and herb chicken kievs - 2 x 260 g
-
Nuggets de poisson pané - 800 g

-
Qualité & Prix Alaska Fillet Fish Sticks - Coop - 150 g
-
Putenschnitzel - Edeka - 500g
-
K-take it veggie Vegan Cutlet - 200 g

-
Cordon bleu

-
Don Pollo Chicken Crispy - Migros - 700 g
-
NÖVÉNYI ALAPÚ VEGÁN FALATKÁK - Penny - 200 g
-
Nuggets de poulet
-
Voorgegaarde Kip Cordon Bleus - 250g
-
Nuggets poulet - Migros
-
12 nuggets de poulet - iglo - 250 g

-
Mozzarella sticks - Migros - 90g

-
6 Portions de Colin d'Alaska Meunière Cuit 70G Prim - Cité Marine - 420 g
-
Nuggets au Poisson Panés - Cite marine - 400 g
-
Vegane mini-schnitzel - Green Legend - 150 g
-
Aiguillettes de poulet à la milanaise - Le Gaulois - 0,218 kg
-
Nuggets de poulet

-
4 Filets de Merlu blanc facon meunière - Loc Marée - 440 g
-
Chickens balls - Culinea - 500 g

-
Cod Fish Fingers - Marks & Spencer

-
Nuggets - Nonos
-
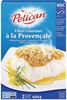
Filets Gourmet à la Provençale MSC Pelican 400g - Migros - 400 g
-
Bastoncini - Findus - 400 g

-
Cordons bleu - 1 g

-
Mcennedy Chicken Nuggets
-
Zigeunerschnitzels - Jumbo - 423 g
-
12 chicken nuggets & dips - 300 g

-
Bâtonnets de poisson - Delhaize - 350 g

-
Veau haché façon Milanaise -
-
Fish sticks - Delhaize

-
Chef Select - 250g
-
Nuggets de poulet - 700 g

-
Cordon bleu - Chef Select
-
Cordon Bleu - Continente - 480 g (4 x 120 g)
-
Toni's mozzarella sticks - 4 x 30 g

-
Nuggets de pollo - Consum
-
P’tits duos cabillaud et patate douce - PESCANOVA - 450 g
-
Cordon bleu de cou de porc - M-Budget
-
Backfischstäbchen - Fjord - 15 Stück / 405 g

-
Cordon bleu - Pingo Doce - 4 x 125 g
-
Chicken pops Piri Piri - Sumeru - 450g

-
Pops de poulet épicé - elburg foods - 1kg
-
Chicken nuggets - Aia - 230 g

-
Nugetts vegetali - My Best Veggie - 200 g
-
Nuggets - vivera - 200 g
-
Vegetarische Nuggets - Aoste - 175 g
-
Vegetable Nuggets - Migros - 9 x 25 g

-
10 cordons de volaille
-
Nuggets de dinde - KERANNA - 1 kg
-
Plant based crispy burger -
