Cow milk yogurts
Belongs to:
Yogurts, Fermented dairy desserts, Dairy desserts, Desserts, Fermented milk products, Fermented foods, Dairies
Nutrition facts
Average nutrition facts for the 1398 products of the Cow milk yogurts category for which nutrition facts are known (out of 1494 products).
| Nutrition facts | As sold for 100 g / 100 ml |
Standard deviation | Minimum | 10th centile | Median | 90th centile | Maximum |
|---|---|---|---|---|---|---|---|
| Energy |
368 kj (88 kcal) |
93 kj (23 kcal) |
0 kj (0 kcal) |
222 kj (53 kcal) |
377 kj (90 kcal) |
540 kj (130 kcal) |
1,870 kj (446 kcal) |
| Fat | 3.25 g | 1.91 g | 0 g | 0.1 g | 3.1 g | 7.6 g | 32 g |
| Saturated fat | 2.1 g | 1.28 g | 0 g | 0.1 g | 2 g | 5 g | 54 g |
| Trans fat | 0.013 g | 0.035 g | 0 g | 0 g | 0 g | 0.15 g | 0.171 g |
| Cholesterol | 10.4 mg | 4.83 mg | 0 mg | 2 mg | 11.4 mg | 20 mg | 33.6 mg |
| Carbohydrates | 10 g | 4.1 g | 1.9 g | 4.1 g | 11.4 g | 15.2 g | 71.4 g |
| Sugars | 9.22 g | 3.94 g | 0 g | 3.7 g | 10.8 g | 14.5 g | 57.1 g |
| Added sugars | 8.11 g | 11.6 g | 0 g | 0 g | 3.33 g | 28.6 g | 28.6 g |
| Fiber | 0.17 g | 0.262 g | 0 g | 0 g | 0 g | 0.653 g | 7.8 g |
| Proteins | 3.96 g | 1.08 g | 0 g | 2.9 g | 3.7 g | 6 g | 34 g |
| Salt | 0.117 g | 0.031 g | 0 g | 0.08 g | 0.11 g | 0.18 g | 127 g |
| Alcohol | 0 % vol | 0 % vol | 0 % vol | 0 % vol | 0 % vol | 0 % vol | 0 % vol |
| Vitamin A | 112 µg | 206 µg | 0 µg | 0 µg | 60 µg | 929 µg | 929 µg |
| Vitamin D | 1.29 µg | 2.17 µg | 0 µg | 0 µg | 1 µg | 10 µg | 20 µg |
| Vitamin C (ascorbic acid) | 11.1 mg | 23.8 mg | 0 mg | 0 mg | 1.26 mg | 71.4 mg | 71.4 mg |
| Calcium | 133 mg | 25.3 mg | 0 mg | 99.9 mg | 126 mg | 188 mg | 160,000 mg |
| Phosphorus | 69.2 mg | 23.9 mg | 15.2 mg | 18.4 mg | 76 mg | 125 mg | 169 mg |
| Iron | 0.172 mg | 0.263 mg | 0 mg | 0 mg | 0.1 mg | 1.01 mg | 132 mg |
| Fruits‚ vegetables‚ nuts and rapeseed‚ walnut and olive oils | 2.47 % | 3.82 % | 0 % | 0 % | 0 % | 10 % | 11.8 % |
| Fruits‚ vegetables‚ nuts and rapeseed‚ walnut and olive oils (manual estimate from ingredients list) | 8.5 % | 2.22 % | 0 % | 5.6 % | 8 % | 12.6 % | 29.4 % |
1,494 products
-
Le yaourt citron bio - La Laitière - 500 g (4x125g)
-
Yaourt Citron au lait entier - Laiterie Du Perigord - 500 g (4 x 125g)

-
Yaourt vanille brassé 400g CC - Biocoop - 400 g

-
YAOURT Á LA GRECQUE nature au lait de vache - Casino Bio - 2 x 150 g

-
Le Yaourt Français Nature - 200 g (2 x 100 g)

-
Yaourt Vanille - Les Vaches à la Rue - 500 g
-
Yoghurt - - 475 g

-
Biologische magre yoghurt - Bioferme - 500 g
-
Yogur cremoso - aspace - 670 gramos

-
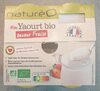
Yaourt bio pur nature - Normandoise - 125 g

-
150 g

-
Yaourt bio vanille - Yogourmand - 500 g
-
Le Yaourt au lait entier Nature - Auchan - 0.5 kg
-
Yaourt à la grecque nature - Biocoop - 400 g
-
Yaourts étuvé nature - Laiterie Du Perigord - 500 g (4 x 125g)

-
Yaourt vanille bio - Marie morin - 140 g
-
Le yaourt gourmeuh - Les 2 vaches - 2x115 g

-
Yaourt au lait entier saveur coco - Malo - 125g

-
Choco Layers

-
Le yaourt Français artisanal - 200 g (2 x 100 g)

-
Yaourt au Lait Entier Saveur Vanille - Franprix - 500 g (4 * 125 g)

-
Yaourt bio myrtille-groseille - Normandoise - 125 gr

-
Yaourt Bio Fraise-Rhubarbe - Normandoise - 125 gr

-
Yaourt brassé bio myrtille - Marie Morin - 140 g

-
Yaourt au lait entier - saveur Citron - Carrefour - 500 g (4 x 125 g)

-
Yaourts au lait entier 4 saveur Citron - Casino - 4 x 125 g

-
Bio-Joghurt - Heidelbeere-Cassis - Rewe Bio - 500 g
-
Yoghurt - Yeo Valley - 950g

-
Yaourt au lait entier parfum coco - U - 4 x 125 g

-
Yaourt bio myrtille sauvage - Invitation à la Ferme - 4 x 125 g

-
Yaourt nature 0% MG - Leader Price - 12x125g

-
Yaourt La fermière citron - 4
-
yaourt nature - La Fermière - 280 g (2 x 140 g)

-
Yaourt nature au bon lait entier - Les 30 fermes de Cant'Avey'Lot - 500 g (4x125g)

-
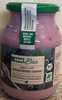
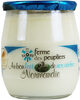
Plain yoghurt - Ferme des Peupliers - 125g
-
Yaourts au lait entier nature - Auchan - 1 kg

-
Yaourt nature - A Gueter! - 2 * 125 g

-
Yaourt vache saveur citron vert - Naturéo
-
Yaourt vache saveur fraise - NaturéO
-
YAOURT CERISES - Franprix - 300 g (2 * 150g)
-
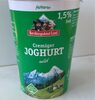
Cremiger JOGHURT mild - Berchtesgadener Land - 500 g
-
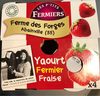
Yaourt fermier fraise - Les P'tits Fermiers - 500 g (4x125g)
-
L'essentiel yaourt brassé à la fraise - Pâturages - (4x100g) 400g
-
Panier de Yoplait, yaourt sucré aux fruits, aromatisé, 100% de morceaux de fruits 4 x 130 g - 1040 g

-
Yaourt au lait du jour de nos vaches - La Ferme Normande - Unité 180 g
-
Gourmand® Yaourt Figue Tournesol Pavot - Mamie Nova - 300 g (2 * 150 g)
-
Le yaourt au lait entier vanille - Auchan - 0.5 kg
-
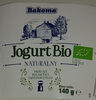
Jogurt naturalny Bio - Bakoma - 140 g
-
Yaourt sur lit de pain d'épice - A Güeter ! - 2 * 125 g

-
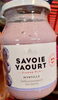
Yaourt Myrtille - Savoie Yaourt - 500 g
-
Yaourts Nature - Le Clos des Vaches - 500g
-
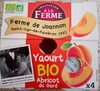
Yaourt bio - Abricot du Gard - Invitation à la Ferme - 4 x 125 g
-
A38 yoghurt - Arla - 1000g
-
Yaourt à la grecque - NaturéO
-
Biologische verse halfvolle yoghurt - Jumbo - 1 L

-
Yaourt de vache à la grecque - Monoprix - 2 x 150 g

-
Esselunga, yogurt intero bianco - 2 x 125g

-
Esselunga Equilibrio, yogurt magro 0% bianco - 2 x 125g
-
Yaourt Nature - Délisse - 4 x 125 g

-
Greek Style Natural Yogurt - Brooklea - 1 kg
-
Yaourt Brassé Sur Lit De Châtaigne - Monoprix - 150 gr
-
Natural Yogurt - Creamfields - 500g
-
Yogur sabor limón - Lacturale - 500 g

-
180G YAOURT LAIT ENTIER DU JOUR MYRTILLE FERMIER - La ferme du manege - 180 g
-
Vanille Yoghurt - Freefrom - 180g

-
Iogurt líquid desnatat Natural - Bonpreu - 1 kg

-
Yoghourt maigre bio - Boni - 1 kg

-
Yaourt entier bio - Boni - 125gr

-
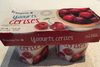
Délice De Yaourt Cerise - Alsace lait - 500 g
-
Yaourts au lait entier Vanille - Casino - 4 x 125 g

-
Natural yogurt - Sainsbury's - 500 g
-
Le Yaourt à la Rhubarbe 100% naturel - La Laitière - 150 g

-
BIO-Fruchtjoghurt Erdbeere - Schwarzwaldmilch - 500 g

-
Bio Fruchtjoghurt Schwarze Johannisbeere - Bourbon Vanille - Schwarzwaldmilch - 500 g
-
Yogur sabor coco - Hacendado - 500 g (4x125g)
-
Yaourt aux myrtilles - Bioferme - 150 g
-
Yaourth a l’abricot - Savoie Yaourt - 125 g
-
Bio chefir - Napolact - 330 g

-
Yogur Griego Natural - Alteza - 500 g
-
-
Greek Style yogurt - Yeo Valley - 150 g
-
Qualité & Prix Jogurt Moka - coop - 720 g (4x180 g)

-
Greek style yoghurt - Yeo Valley - 450 g
-
yaourt aromatisé goût banane - Natilait - 110 g
-
Yaourt saveur Fruits Exotiques - Delice - 200 g

-
Yaourt nature - grandeur nature - 4x125g

-
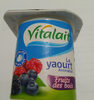
Yaourt Fruits Des Bois - Vitalait - 100 g
-
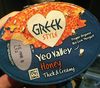
Greek style Honey - Yeo Valley - 400 g
-
Yaourt au lait entier saveur vanille - Malo

-
Joghurt Stracciatella - Ehrmann - 500g
-
Yaourt Blaubeere-Cassis - Andechser - 400g

-
Yaourt nature sucré sur lit de fruits, aromatisé - Yoplait - 270 g
-
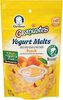
Yogurt Melts Mixed Berries - Gerber - 1 oz (28 g)

-
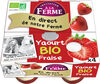
Yaourt à la fraise Fermier et Bio - Invitation à la Ferme - 4 x 125 g
-
Yogurt Melts Peach - Gerber - 1 oz (28 g)
-
Yogurt Mora - Pil - 1000 g
-
Biogurt sabor Frutilla - 1000 g
-
Biogurt sabor Durazno - 1000 g

-
Le Yaourt - La Fermière - 140 g

-
Family Farm 0% Fat Natural - Yeo Valley - 500 g