Mushrooms - Page 26
Belongs to:
Mushrooms and their products, Vegetables based foods, Fruits and vegetables based foods, Plant-based foods, Plant-based foods and beverages
Contains:
- Bloody milk caps
- Caesar's mushrooms
- Canned mushrooms
- Cep mushrooms
- Champignon mushrooms
- Chanterelles
- Field mushrooms
- Fresh mushrooms
- Frozen mushrooms
- Horn of plenty mushrooms
- Hygrophorus latitabundus
- Jew's ear mushrooms
- King trumpet mushrooms
- Mixed mushrooms
- Morel
- Nameko mushrooms
- Oyster mushrooms
- Paddy straw mushrooms
- Pickled Mushrooms
- Porcini mushrooms
- Red pine mushrooms
- Scotch bonnet mushrooms
- Shiitake mushrooms
- Truffles
Nutrition facts
Average nutrition facts for the 1823 products of the Mushrooms category for which nutrition facts are known (out of 2555 products).
| Nutrition facts | As sold for 100 g / 100 ml |
Standard deviation | Minimum | 10th centile | Median | 90th centile | Maximum |
|---|---|---|---|---|---|---|---|
| Energy |
273 kj (67 kcal) |
367 kj (89 kcal) |
0 kj (0 kcal) |
63 kj (15 kcal) |
100 kj (24 kcal) |
1,210 kj (292 kcal) |
3,390 kj (824 kcal) |
| Fat | 1.43 g | 2.63 g | 0 g | 0 g | 0.5 g | 6 g | 100 g |
| Saturated fat | 0.293 g | 0.582 g | 0 g | 0 g | 0.1 g | 1.1 g | 45.9 g |
| Trans fat | 0 g | 0 g | 0 g | 0 g | 0 g | 0 g | 0.1 g |
| Cholesterol | 0.639 mg | 3.78 mg | 0 mg | 0 mg | 0 mg | 0 mg | 47 mg |
| Carbohydrates | 4.71 g | 8.12 g | 0 g | 0.4 g | 1.6 g | 24 g | 81.2 g |
| Sugars | 0.868 g | 1.31 g | 0 g | 0 g | 0.5 g | 3 g | 81.2 g |
| Fiber | 3.62 g | 4.75 g | 0 g | 0.9 g | 2.3 g | 15 g | 79 g |
| Proteins | 3.79 g | 4.45 g | 0 g | 1.5 g | 2.4 g | 15.3 g | 48.2 g |
| Salt | 0.498 g | 0.399 g | 0 g | 0.01 g | 0.58 g | 1.17 g | 96.3 g |
| Alcohol | 0 % vol | 0 % vol | 0 % vol | 0 % vol | 0 % vol | 0 % vol | 8 % vol |
| Vitamin A | 8.46 µg | 27.2 µg | 0 µg | 0 µg | 0 µg | 69.9 µg | 15,000,000 µg |
| Vitamin D | 1.64 µg | 3.42 µg | 0 µg | 0 µg | 0.475 µg | 240 µg | 240 µg |
| Vitamin C (ascorbic acid) | 1.85 mg | 3.95 mg | 0 mg | 0 mg | 0 mg | 12 mg | 12,000 mg |
| Vitamin B2 (Riboflavin) | 0.854 mg | 1.39 mg | 0.034 mg | 0.255 mg | 0.45 mg | 5 mg | 136 mg |
| Potassium | 294 mg | 169 mg | 0 mg | 60 mg | 334 mg | 667 mg | 1,530 mg |
| Calcium | 8.55 mg | 20.5 mg | 0 mg | 0 mg | 0 mg | 93 mg | 10,000 mg |
| Iron | 1.15 mg | 1.38 mg | 0 mg | 0 mg | 0.72 mg | 3.86 mg | 1,080 mg |
| Fruits‚ vegetables‚ nuts and rapeseed‚ walnut and olive oils | 73.4 % | 36.7 % | 0 % | 0 % | 95 % | 100 % | 100 % |
| Fruits‚ vegetables‚ nuts and rapeseed‚ walnut and olive oils (manual estimate from ingredients list) | 86.1 % | 18.5 % | 56.7 % | 57 % | 100 % | 100 % | 100 % |
2,543 products
-
Girolle Cantharellus Cibarius - Bonechamp - 150 g
-
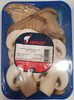
Champiñones laminados - Angelita - 250 g
-
Champignons de Paris - mélange à étuver - carrefour - 400 g

-
Champignon Pleurote 2kg -

-
Funghi pleurotus eryngii (cardoncelli) - Murgello - 300 g
-
Baby bella sliced mushrooms - Kroger - 8 oz
-
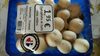
Champiñon Entero - Monteblanco - 225 g
-
Champignons

-
Sliced white mushrooms - Kroger - 8 oz
-
Champiñones pequeños - Champinter
-
Champiñon - Champinter
-
Pleurotes grises - Migros - 200g

-
Champignons de Paris - Robson - 250 g
-
Champignons de paris -

-
Champignons de paris - - 125 g
-
Enoki -
-
Setas Cultivadas - Albachamp - 200g
-
Champiñon pequeño - Champinter

-
Champiñon laminado - Cumar - 200 g
-
Champignons frisch - - 250 g
-
Champiñón laminado - Ruol
-
Champignons de paris pieds entiers (France) - Renaud et fils (charente maritime) - 250g
-
Ekologisk Champinjon - Banken Champignos - 250g
-
champignons - Ruol - 200 g

-
Champignon pleurote bio, France - Bio Fort & Vert - 100 g
-
Champignons Divers bio : Shii-Take Suisse - Migros - 200g

-
Champignons - Everyday - 500g

-
Champiñones -

-
Braune Champignons - EDEKA Bio - 200g
-
Seta laminada - Hongos de la Jara
-
Button Mushrooms - Morrisons

-
Champignons de Paris - - 250 g
-
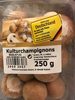
Kulturchampignons - Marktfrisch aus Deutschland - 500 g

-
Kulturchampignons - - 250g

-
Champiñón laminado - Champinter
-
Champignons Blancs de Paris - Banken - 250g
-
Champignons de Paris - Origine Hollande - 250g

-
Champignons de paris - Intermarché - 500 g

-
Champignons mélangés émincés : Chanterelles - Migros - 250g

-
Les champignons de Paris - 900 g
-
Champignons

-
Champignons de Paris - 500 g
-
Champignons de Paris blanc - Ruol - 250 g

-
Champignons de Paris - Ferme de la Gontière - 300 g
-
Champignon de paris -
-
Champignons de Paris -

-
Champignons de paris -
-
Champignons de Paris - 200 g
-
Champignons
-
Champignons - M Budget - 500 g
-
Champignon de Paris Rosé - Ferme de la gontiere - 250 g
-
Champignons de Paris - - 500 g
-
Champignon de paris
-
Champiñon pequeño - Champinter
-
Champiñon pequeño - Champinter
-
Witte champignons gesneden - Delhaize - 300 g
-
Champiñón grande - Champinter
-
Champiñón laminado - Champinter