Frozen berries
Belongs to:
Frozen fruits, Fruits, Frozen plant-based foods, Fruits based foods, Frozen foods, Fruits and vegetables based foods, Plant-based foods, Plant-based foods and beverages
Contains:
Nutrition facts
Average nutrition facts for the 422 products of the Frozen berries category for which nutrition facts are known (out of 453 products).
| Nutrition facts | As sold for 100 g / 100 ml |
Standard deviation | Minimum | 10th centile | Median | 90th centile | Maximum |
|---|---|---|---|---|---|---|---|
| Energy |
202 kj (49 kcal) |
42 kj (10 kcal) |
0 kj (0 kcal) |
138 kj (33 kcal) |
205 kj (50 kcal) |
273 kj (66 kcal) |
1,870 kj (447 kcal) |
| Fat | 0.422 g | 0.279 g | 0 g | 0 g | 0.5 g | 0.8 g | 21.4 g |
| Saturated fat | 0.062 g | 0.088 g | 0 g | 0 g | 0.01 g | 0.2 g | 12.5 g |
| Trans fat | 0 g | 0 g | 0 g | 0 g | 0 g | 0 g | 0 g |
| Cholesterol | 0 mg | 0 mg | 0 mg | 0 mg | 0 mg | 0 mg | 0 mg |
| Carbohydrates | 8.69 g | 2.95 g | 1.67 g | 5.1 g | 7.8 g | 13.8 g | 68 g |
| Sugars | 7.04 g | 1.98 g | 0 g | 4.4 g | 6.5 g | 11 g | 66 g |
| Fiber | 3.68 g | 1.58 g | 0 g | 1.6 g | 3.3 g | 6.5 g | 56 g |
| Proteins | 0.932 g | 0.302 g | 0 g | 0.5 g | 0.9 g | 1.4 g | 12 g |
| Salt | 0.008 g | 0.01 g | 0 g | 0 g | 0 g | 0.03 g | 7.25 g |
| Vitamin A | 8.37 µg | 13 µg | 0 µg | 0 µg | 0 µg | 42.9 µg | 375 µg |
| Vitamin D | 0 µg | 0 µg | 0 µg | 0 µg | 0 µg | 0 µg | 0 µg |
| Vitamin C (ascorbic acid) | 11.7 mg | 10.2 mg | 0 mg | 2.6 mg | 7.8 mg | 30 mg | 58,000 mg |
| Potassium | 132 mg | 77.6 mg | 50 mg | 54 mg | 127 mg | 321 mg | 210,000 mg |
| Calcium | 18.4 mg | 20 mg | 0 mg | 0 mg | 19.7 mg | 107 mg | 20,000 mg |
| Iron | 0.456 mg | 0.307 mg | 0 mg | 0 mg | 0.51 mg | 0.8 mg | 1,100 mg |
| Fruits‚ vegetables‚ nuts and rapeseed‚ walnut and olive oils | 100 % | 0 % | 100 % | 100 % | 100 % | 100 % | 100 % |
| Fruits‚ vegetables‚ nuts and rapeseed‚ walnut and olive oils (manual estimate from ingredients list) | 98.3 % | 4.71 % | 85 % | 85 % | 100 % | 100 % | 100 % |
453 products
-
Mix frutos rojos - Hacendado - 300 g
-
Mélange de fruits rouges - Freshona - 750g
-
Framboises entières - Picard - 450 g
-
Cocktail de fruits rouges surgelé - Picard - 450 g e

-
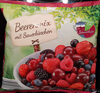
Berry mix with sour cherries - Freshona (lidl) - 750 g
-
Fruits rouges surgelés - Greenyard - 1 kg

-
Salade aux fruits rouges - Picard - 750 g ℮

-
Arándanos enteros - Hacendado - 300 g
-
Myrtilles sauvages - Fruistar - 650 g
-
Fresas Congeladas - Hacendado - 300 g

-
Myrtilles - Bio Organic - 300g
-
Framboises surgelées - Lidl

-
Fruits rouges - Fruistar - 650 g
-
Himbeeren - Lidl - 500g
-
blueberries

-
Frozen blueberries - Sainsbury's - 400

-
Fresas congeladas - Carrefour - 650 g
-
Framboises entières - U - 1 kg
-
Frozen blueberries - Asda

-
Fraises entières - Paquito - 450 g

-
Framboises entières - Picard - 750 g
-
Myrtilles sauvages bio - Picard - 450 g

-
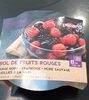
Bol de fruits rouges - Picard - 150 g
-
Beerenmix mit Sauerkirschen - Lidl - 750 g
-
Framboises Entières Surgelées 1kg - Picard - 1 Kg
-
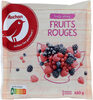
Fruits entiersFruits rouges - Auchan - 0.45 kg
-
Blueberries - Picard - 450 g

-
Cocktail de fruits rouges - U - 1 kg
-
Erdbeeren - Lidl - 1000g
-
Framboise Surgelé - Carrefour Classic - 500 g

-
Myrtilles sauvages naturellement douces & sucrées - U - 450 g
-
Fresas congelada con azucar - Colorfoods - 226 g
-
Heidelbeeren - Edeka Bio - 300g

-
Fraises entières - Picard - 600 g
-
Fraises entieres - Douceur du Verger - 650 g
-
Framboises surgelées bio - LIDL - 300g

-
Erdbeeren ohne zuckerzusatz tiefgefroren - Edeka - 250g
-
Himbeeren - All Seasons - 500g
-
Himbeeren - REWE - 200g
-
Beerenmix - REWE Bio - 300 g
-
Erdbeeren - Lidl - 750g

-
Mezcla de frutas rojas - Hacendado - 300 g
-
Cocktail De Fruits Rouges - Picard - 450 g e

-
Beutel Heidelbeeren - Lidl - 1pcs

-
Framboises Brisées 1 Kilo - Picard - 1 kg

-
Cocktail De Fruits Rouges Surgelés - Adelie - 750 g
-
Wild-Heidelbeeren - Edeka - 282g
-
Bio-Himbeeren, tiefgefroren - Gut Bio - 300 g

-
Melange de fruits rouges surgelés

-
Himbeeren - Greenyard - 750 g
-
Heidelbeeren - Rewe - 500 g

-
framboises entières - Golden fruit - Framboises 100%
-
Himbeeren - Green Grocer's - 500 g

-
Framboises entières - Fruistar - 1 kg
-
Himbeer-Heidelbeer-Mix - Rewe Beste Wahl - 1
-
heidelbeeren - Lidl - 300g

-
Mélange de fruits rouges - Casino - 600 g
-
Myrtilles sauvages - Adélie - 750 g
-
Cocktail de Fruits Rouges - Leader Price - 600 g

-
Framboises entières - Paquito - 750 g
-
Fresas enteras - Hacendado - 300 g
-
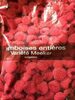
Arándanos enteros - Hacendado - 300 g
-
Framboises Entières - Carrefour - 650 g

-
Fraises surgelées - Lidle - 750g
-
Gefrorene Erdbeeren - Green Grocer's - 750 g
-
Framboises Entières - Leader Price - 600 g
-
Fraises surgelées
-
Mélange de fruits rouges - Carrefour bio - 400 g

-
Himbeeren (TK) - ALNATURA - 300 g
-
Fraises surgelées - Lidl France - 750g

-
Fruits rouges surgelés - Paquito
-
Bio-Beerenmischung, tiefgefroren - Gut Bio - 300 g
-
Myrtilles - Boni
-
Wildheidelbeeren (TK) - ALNATURA - 300 g

-
Framboises entières - Paquito - 450 g

-
Erdbeeren (TK) - ALNATURA - 300 g

-
Mélange de fruits rouges - Crop’s
-
Cocktail de fruits rouges BIO - Paquito - 450 g
-

-
Berry Medley - Walmart - 16 oz
-
Framboises surgelées - - 1 kg

-
Triple Berry Blend - Great Value
-
Frozen Blackberries - Boylans fruit farm - 300g
-
Framboises Entieres - Monoprix - 500 g
-
Fraises Entières Surgelées - Monoprix

-
Suomalainen mustikka - Södergården - 300 g
-
Arándanos - congelados de navarra - 300 g
-
Frozen blueberries - Pam’s

-
Myrtilles - Paquito
-
Bosvruchtenmix - Freshona

-
Strawberry - Al Ahram - 400 g
-
Blauwe bessen - Arctic fruit
-
Beeren Mischung - Beste Ernte - 1pcs
-
Himbeeren-Heidelberen-Mix - Spar - 250g
-
Beeren-Mischung, tiefgefroren - Jütro Tiefkühlkost - 500 g

-
Mustikka pakaste - Pirkka - 200 g

-
Bosvruchten - Gwoon - 750g
-
All seasons myrtilles surgelees

-
Blackberries, Unsweetened, frozen - Western Family • Save On Foods - 600 g

-
Granaattionenan siemen pakaste - Pirkka - 250 g
