Ice cream tubs
Belongs to:
Ice creams, Ice creams and sorbets, Frozen desserts, Frozen foods, Desserts
Contains:
- Berries ice cream tubs
- Chestnut ice cream tubs
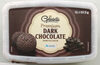
- Chocolate ice cream tubs
- Coconut ice cream tubs
- Coffee ice cream tubs
- Hazelnut ice cream tubs
- Lemon ice cream tubs
- Mint ice cream tubs
- Nougat ice cream tubs
- Pecan nut ice cream tubs
- Pistachio ice cream tubs
- Rum and raisins ice cream tubs
- Stracciatella ice cream tubs
- Strawberry ice cream tubs
- Vanilla ice cream tubs
- White chocolate ice cream tubs
- es:Helado de vainilla y almendras
- es:Helado de vainilla y chocolate blanco
- es:Helado de vainilla y macadamia
- fr:Glaces au caramel
- fr:Glaces aux amandes
Nutrition facts
Average nutrition facts for the 3288 products of the Ice cream tubs category for which nutrition facts are known (out of 3538 products).
| Nutrition facts | As sold for 100 g / 100 ml |
Standard deviation | Minimum | 10th centile | Median | 90th centile | Maximum |
|---|---|---|---|---|---|---|---|
| Energy |
873 kj (209 kcal) |
152 kj (36 kcal) |
0 kj (0 kcal) |
606 kj (146 kcal) |
870 kj (208 kcal) |
1,120 kj (270 kcal) |
2,630 kj (1020 kcal) |
| Fat | 10.2 g | 3.27 g | 0 g | 5.2 g | 9.9 g | 16 g | 28 g |
| Saturated fat | 6.36 g | 2.08 g | 0 g | 3 g | 6.3 g | 10 g | 21 g |
| Trans fat | 0.127 g | 0.139 g | 0 g | 0 g | 0.08 g | 0.4 g | 0.781 g |
| Cholesterol | 38.1 mg | 15.3 mg | 0 mg | 15 mg | 37 mg | 66.5 mg | 150 mg |
| Carbohydrates | 25.4 g | 3.85 g | 0 g | 18.4 g | 25.6 g | 31 g | 85 g |
| Sugars | 21.7 g | 3.81 g | 0 g | 14 g | 22 g | 27 g | 65 g |
| Added sugars | 16.7 g | 4.23 g | 0 g | 10.8 g | 18.1 g | 21.2 g | 23 g |
| Polyols (sugar alcohols) | 6.94 g | 3.09 g | 2.13 g | 4.26 g | 5.85 g | 16.5 g | 23 g |
| Fiber | 0.768 g | 0.74 g | 0 g | 0 g | 0.5 g | 2.3 g | 30.8 g |
| Proteins | 3.35 g | 0.932 g | 0 g | 1.75 g | 3.4 g | 4.71 g | 39 g |
| Salt | 0.154 g | 0.07 g | 0 g | 0.07 g | 0.14 g | 0.3 g | 104 g |
| Alcohol | 0.636 % vol | 0.846 % vol | 0 % vol | 0 % vol | 0 % vol | 2.25 % vol | 4.9 % vol |
| Vitamin A | 100 µg | 45.6 µg | 0 µg | 0 µg | 120 µg | 154 µg | 225 µg |
| Vitamin D | 0.265 µg | 0.387 µg | 0 µg | 0 µg | 0 µg | 1 µg | 3.98 µg |
| Vitamin C (ascorbic acid) | 0.428 mg | 0.969 mg | 0 mg | 0 mg | 0 mg | 2.88 mg | 6.5 mg |
| Potassium | 158 mg | 54.8 mg | 26.6 mg | 79.8 mg | 160 mg | 250 mg | 4,000 mg |
| Calcium | 97.8 mg | 26.8 mg | 0 mg | 53.2 mg | 98.9 mg | 143 mg | 343 mg |
| Iron | 0.52 mg | 0.54 mg | 0 mg | 0 mg | 0.266 mg | 1.6 mg | 5.07 mg |
| Fruits‚ vegetables‚ nuts and rapeseed‚ walnut and olive oils | 11.6 % | 15 % | 0 % | 0 % | 7 % | 50 % | 60 % |
| Fruits‚ vegetables‚ nuts and rapeseed‚ walnut and olive oils (manual estimate from ingredients list) | 10.2 % | 5.68 % | 3 % | 3 % | 10 % | 23 % | 46.6 % |
3,527 products
-
CARTE D'OR Glace Crème Glacée Vanille de Madagascar 900ml - 472 g

-
Cookie Dough Ice Cream - Ben & Jerry's - 406 g
-
Cdo 900ml chocolat noir - Unilever - 482 g

-
CDO 900ml Cafe DENVER CL1 20A X6x120EB - Unilever - 481 g
-
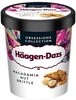
Glace Macadamia Nut Brittle - Häagen-Dazs - 81 g

-
Ben Jerrys Choc Fudge Brownie 465ml - Ben & Jerry's - 408 g
-
CDO 900ml CremVanila DENVCL1 20Ax6x120EB - Carte D'or - 472 g
-
Crème glacée Vanille - L'Angélys - 450 g

-
Vanilla Ice Cream - Häagen-Dazs - 460 ml / 400g

-
CDO 900ml SaltCaramelDNV CL1 20Ax6x120EB - Carte D'or - 480 g
-
Chocolate ice cream and vanilla ice cream with chocolate cake mix (8%) and cookie dough with chocolate chunks (10%) - Ben & Jerry's - 406 g
-
High Protein Eis Chocolate - Gelatelli - 265g
-
Häagen-Dazs Vanille - 400g

-
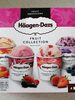
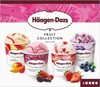
Fruit collection - Häagen-Dazs - 4 x 95 ml
-
Salted caramel - Häagen-Dazs - 400g
-
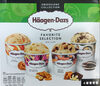
Favorite Selection Mini Cups - Häagen-Dazs - 4 X 95 ml
-
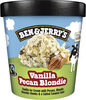
B&j vanille pecan 465ml - Ben & Jerry's - 414 g
-
Macadamia Nut Brittle Pint - Häagen-Dazs - 460ml
-
Cdo 900ml vanille pecan - Carte D'or - 500 g
-
salted caramel - Häagen-Dazs - 84g
-
Yes rouge
-
Premium Eiscreme mit Schlagsahne - BON GELATI - LIDL - 1000 ml, 500 g

-
Crème glacée à la vanille de Madagascar - U Bio - 471 g

-
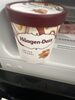
Glace vanille pécan - Häagen-Dazs - 400g

-
Favorite selection mini cups - Häagen-Dazs - 81 g

-
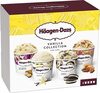
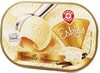
vanilla collection - Häagen-Dazs - 324 g
-
Carte D'or Glace Crème Glacée Menthe 900ml - 491 g
-
Bourbon vanilla glace Lidl - Bon Gelati - 1 L
-
Creme glacée vanille - Picard - 550 g

-
Carte D'Or Magadascan Vanilla - 900 ml

-
Bourbon Vanilla - GelatelliBon Gelati - 2500 ml

-
La vanille de Madagascar - Pure Sélection - Picard - 500ml, 380g

-
Bac vanille de Madagascar (CG) - BIO - 900mL - Adélie - 900 g

-
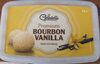
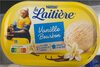
Glace Vanille Bourbon - La Laitière - 490 g
-
Bio Vanille de Madagascar - Carrefour

-
Crème glacée vanille - Carrefour - 500 g

-
Triple taste ice cream - GelatelliEcorinoLidl - 2l ℮ (937g)
-
Ben & Jerry's Sundae Cookie Verm 427ml - 324 g
-
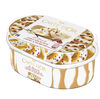
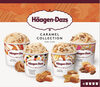
Caramel collection - Häagen-Dazs
-
Pistache-Pistacho - Carrefour - 500 g (1 l)
-
Eiscreme Bourbon Vanille - Cremissimo - 1300ml

-
Ice cream - Waitrose - 480 ml
-
Cookies on Cookie Dough Non-Dairy Ice Cream - Ben & Jerry's - 465 ml

-
Magnum Batonnet Gold Caramel Billion 85ml - 71 g

-
Glace Manguo &raspberry - Häagen-Dazs

-
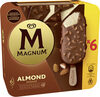
Magnum Almond-3,69€/1.7.22 - 6 x 82g
-
Macadamia nut brittle mini cups - Häagen-Dazs - 100g

-
Glace Vanille Bourbon - Thiriet - 1 l
-
Ben & Jerry's Sundae Dulce De-lish 427ml - 350 g
-
Clotted Cream ice cream - Kelly’s
-
Glace à l'italienne - citron façon Limoncello - Picard - 350 ml e / 200 g e
-
Speculos caramel biscuit & cream - Häagen-Dazs - 81g=95ml
-
Glace chocolat La Laitière - Nestlé - 490 g

-
Crème Glacée Vanille - U - 500 g

-
Salted caramel premium ice cream - GELATELLI - 1pcs
-
Bac crème glacée chocolat noir - Gelatelli - 513 g
-
Mini cup macaron duo fraise chocolat - Häagen-Dazs - 332 g / 380 ml
-
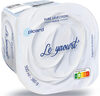
Le Yaourt - Picard - 380 g
-
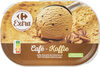
Café - Carrefour - 1 l
-
Glace Vanille de Madagascar - Carte D'or - 629 g
-
Crème glacée chocolat noir - U Bio - 495 g
-
Mini pots crème glacée caramel collection - Häagen-Dazs - 324 g (4 x 81 g)
-
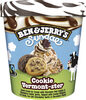
Ben & Jerry's Netflix & Chill'd - 405 g

-
Häagen-Dazs - 386g
-
Batonnet Chocolat Intense Dark - Magnum - 296 g

-
Chocolatey love A-fair - Ben & jerrys - 402 g
-
Chocolat noir avec copeaux - Carrefour - 1 L
-
Bon Gelati Ice Cream - lidl - 1L
-
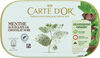
Crème glacée menthe chocolat - Carrefour - 500 g
-
Bon Gelati Eiscreme mit Schlagsahne - Gelatelli - 1000 ml / 517 g
-
La Laitière (Glace) Caramel Beurre salé - 490 g

-
Nocciolata - Gelatelli - 900 ml (515 g)
-
Belgian Chocolate Ice Cream - Häagen-Dazs
-
Mars glacé caramel au beurre salé x6 - 270 ml
-
Bac chocolat (CG) - BIO - 900mL - Adélie - 900 g

-
VANILLA COLLECTION - Häagen-Dazs - 4 X 95 ml

-
Vanilla Clotted Ice Cream - Jude's - 460ml

-
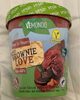
Choco Brownie Love - Gelatelli - 500ml
-
Cookies & Cream - Häagen-Dazs - 460ml
-
Pot de glace Cookies & Cream - gelatelli - 416g
-
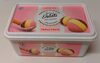
Pot de glace Vanille & Macadamia - Gelatelli - 500 ml

-
Salted Caramel Ice cream - Haagen Dazs - 400g

-
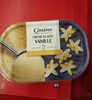
Crème glacée Vanille A la vanille de Madagascar - Casino - 500 g
-
Mini cups - fruit collection - Häagen-Dazs
-
Pure sélection - Crème glacée Le café - Picard - 500ml-380g
-
Crème glacée Rhum avec des raisins macérés au rhum - Picard - 1 L (555 g)

-
Glace Strawberries and Cream - Häagen-Dazs

-
Cremissimo Bourbon Vanilleeis - Unilever - Packung
-
Crème glacée vanille de madagascar - Adelie - 1 L
-
Crème glacée Vanille - La Manufacture des Belles Glaces - 487,5 g

-
Macadamia nut brittle - Häagen-Dazs - 650 ml

-
Glace Pistache - Unilever - 479 g
-
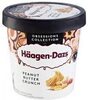
Peanut butter crunch - Häagen-Dazs - 460ml
-
Vrac crème glacée vanille - Eskiss - 1 l
-
Stracciatella Premium Eis - Bon Gelati - 200g
-
Magnum White 8mp X110ML 4x - 632 g

-
Crème glacée pistache - L'Angélys

-
Crème glacée - L'Angélys - 500 g

-
Taste the Difference iced coffee ice cream

-
Salted Caramel - Häagen-Dazs - 81g