Cooked vegetables
Belongs to:
Prepared vegetables, Plant-based foods, Plant-based foods and beverages
Contains:
- Cooked beetroots
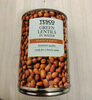
- Cooked blond lentils
- Cooked broad beans
- Cooked broccoli
- Cooked Brussels sprouts
- Cooked cardoons
- Cooked carrots
- Cooked cassava
- Cooked cauliflowers
- Cooked celeriac
- Cooked celery stalks
- Cooked chick peas
- Cooked Chinese cabbage
- Cooked curly kale
- Cooked French beans
- Cooked garden peas
- Cooked globe artichoke
- Cooked green lentils
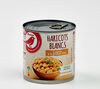
- Cooked haricot beans
- Cooked leeks
- Cooked lentils
- Cooked mixed vegetables for couscous
- Cooked New Zealand spinach
- Cooked onions
- Cooked parsnip
- Cooked peppers
- Cooked pink lentils
- Cooked pulp and peel courgette
- Cooked pumpkins
- Cooked red kidney beans
- Cooked rutabaga
- Cooked salsify
- Cooked shallots
- Cooked spinach
- Cooked sweet peppers
- Cooked sweet potatoes
- Cooked Swiss chard
- Cooked taro tubes
- Cooked turnips
- Cooked white beans in tomato sauce
Nutrition facts
Average nutrition facts for the 351 products of the Cooked vegetables category for which nutrition facts are known (out of 381 products).
| Nutrition facts | As sold for 100 g / 100 ml |
Standard deviation | Minimum | 10th centile | Median | 90th centile | Maximum |
|---|---|---|---|---|---|---|---|
| Energy |
360 kj (89 kcal) |
202 kj (51 kcal) |
0 kj (0 kcal) |
117 kj (28 kcal) |
347 kj (83 kcal) |
773 kj (190 kcal) |
2,170 kj (519 kcal) |
| Fat | 1.39 g | 1.81 g | 0 g | 0.1 g | 0.6 g | 5.4 g | 36 g |
| Saturated fat | 0.254 g | 0.355 g | 0 g | 0 g | 0.1 g | 1.1 g | 9.4 g |
| Trans fat | 0 g | 0 g | 0 g | 0 g | 0 g | 0 g | 0 g |
| Cholesterol | 0 mg | 0 mg | 0 mg | 0 mg | 0 mg | 0 mg | 0 mg |
| Carbohydrates | 11.3 g | 5.56 g | 0 g | 3.7 g | 11 g | 21 g | 91.7 g |
| Sugars | 2.6 g | 2.56 g | 0 g | 0 g | 1.5 g | 7.57 g | 48 g |
| Fiber | 3.68 g | 1.85 g | 0 g | 1.4 g | 3.1 g | 6.92 g | 75 g |
| Proteins | 3.89 g | 2.47 g | 0 g | 1 g | 3.4 g | 7.9 g | 57 g |
| Salt | 0.466 g | 0.311 g | 0 g | 0.03 g | 0.48 g | 1 g | 72 g |
| Alcohol | 0 % vol | 0 % vol | 0 % vol | 0 % vol | 0 % vol | 0 % vol | 0 % vol |
| Vitamin A | 5,020 µg | 15,000 µg | 0 µg | 0 µg | 0 µg | 50,000 µg | 984,000 µg |
| Vitamin C (ascorbic acid) | 4.27 mg | 5 mg | 0 mg | 0 mg | 1.9 mg | 12.7 mg | 66.7 mg |
| Potassium | 155 mg | 94.9 mg | 0 mg | 66.7 mg | 133 mg | 320 mg | 340 mg |
| Calcium | 28.1 mg | 11.7 mg | 0 mg | 10 mg | 32 mg | 46.2 mg | 60 mg |
| Iron | 1.32 mg | 0.904 mg | 0 mg | 0.2 mg | 1.38 mg | 3.69 mg | 3.69 mg |
| Fruits‚ vegetables‚ nuts and rapeseed‚ walnut and olive oils | 54.3 % | 45.7 % | 0 % | 0 % | 83 % | 100 % | 100 % |
381 products
-
Puy Lentils & French green lentils - Merchant Gourmet - 250 g

-
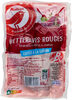
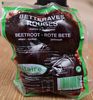
Betteraves rouges - Saladinettes - 500 g

-
Green Lentils In Water - Tesco - 390 g
-
Red Kidney Beans in Water - Freshona - 242 g

-
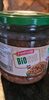
Lentilles cuites dans très peu de jus - Bonduelle - 265 g

-
Pois chiches, graines de courge & touche de romarin - Cassegrain - 400 g

-
Couscous de légumes à l'orientale - Carrefour - 660 g

-
Lenteja pardina - Hacendado - 570 g

-
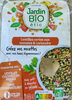
Légumes pour couscous et plats orientaux - Jardin Bio étic - 660 g

-
Ratatouille cuisinée - Picard - 1 kg
-
Haricot Beans In Water - Tesco - 400 g
-
Haricots verts extra croquants cuits à la vapeur - Bonduelle - 590g
-
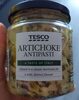
Artichoke antipasti - Tesco - 285g (160g)
-
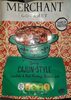
Spicy Cajun-Style Lentils & Red Kidney Beans - Merchant Gourmet - 250 g
-
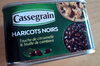
Haricots noirs, touche de citronnelle & feuille de combava - Cassegrain - 400 g
-
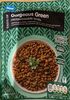
Taste of Gorgeous Green - Lidl - 250g
-
Lenteja pardina - Hacendado - 295 g

-
Couscous de légumes à l'orientale - Carrefour - 400 g

-
Betteraves rouges – cuites à la vapeur - Auchan - 0.5 kg

-
Betteraves rouges - Monique ranou - 300 g

-
Maquereaux - Saupiquet - 120 g

-
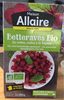
Betteraves rouges issues de l'agriculture biologique - Allaire - 500 g

-
Légumes Pour Couscous - Carrefour Bio - 660g / 720 ml
-
Betteraves - Notre Jardin - 500 g

-
Betterave rouge - U Bio - 500 g
-
Tartex Spinat Pinienkerne - 135g
-
Salade de betteraves rouges à la moutarde à l'ancienne - Carrefour - 300 g
-
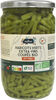
Haricots Verts Bio Légumes 100% Français - Bonduelle - 280 g

-
Betteraves rouges – cuites à la vapeur - épluchées et prêtes à l'emploi - Label Rouge - Auchan - 0.5 kg
-
Lentilles sauce moutarde, émincés de porc - William Saurin - 300 g
-
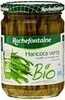
Rochefontaine Haricots Verts Extra Fins Bio 530 g - 580 ml
-
Cooked Beetroot - Oaklands - 500g
-
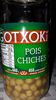
Gotxoki Pois Chiches - 660g poids net égoutté 450g
-
Lentilles du lauragais - U saveurs - 400 g

-
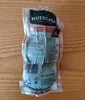
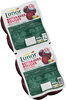
Cooked beetroot - Huercasa - 500 g
-
Chick peas - Alnatura - 350 g

-
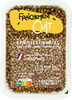
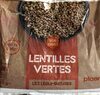
LENTILLES VERTES 300 G FRAICHEMENT CUIT by LUNOR - 300 (300)
-
Betteraves rouges bio ent. eplu. 500g - Saint Éloi - 500 g

-
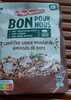
Galette lentilles corail curry gingembre - Céréalpes - 200 g

-
Gnocchi de patate douce et épinards - Picard - 120 g e

-
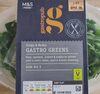
Gastro Greens - Marks and Spencers - 210g
-
Betteraves Rouges cuites - Terr'Loire - 500 g

-
Haricots verts extra fins coupés - Freshona

-
Betteraves Rouges cuites à la vapeur - Auchan - 0.5 kg

-
Les DIPS - Nature Addicts - 140g

-
Haricots blancs cuisinés à la graisse d'oie - Auchan - 0.4 kg
-
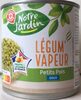
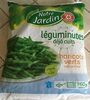
Petits pois doux vapeur - Notre Jardin - 265g égouttés
-
Betteraves rouges - Terr'loire - 500 g

-
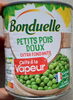
Petits pois doux extra fondants cuits à la vapeur - Bonduelle - 530 g
-
Betteraves rouges - Cormoreche - 500 g
-
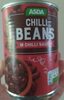
ASDA Chili Beans in Chilli Sauce - 390g
-
Betteraves rouges Bio - daniel allaire sas - 500g
-
Steamed Beetroot in vinegar - Tesco - 300g
-
Betteraves rouges cuites sous vide - Fresh Garden - 500 g e
-
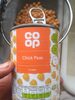
Chick peas - Co op - 400g / 242g drained weight
-
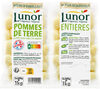
Pommes de terre - Lunor - 1 Kg (2 x 500 g)
-
Cooked Beetroot in Natural Juice - Greens
-
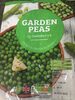
Garden Peas - Sainsbury’s
-
Betterave rouges cuites à la vapeur - Allaire - 500 g
-
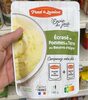
Écrasé de pommes de terre - Paul & Louise - 180 g
-
Lentilles vertes - Picard - 50 g
-
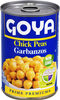
Chick pea - Goya - 439 g
-
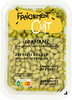
Edamame - Fraîchement Cuit - 210 (210)
-
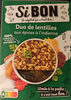
Duo de lentilles aux épices à l'indienne - SI BON - 280 g
-
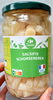
Salsifis - Carrefour - 395 g égouttés
-
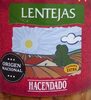
Lentejas - Hacendado - 570 g
-
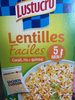
Lentilles faciles - Lustucru - 300 g
-
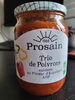
Trio de Poivrons - Prosain - 650g
-
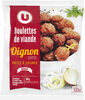
Boulettes de boeuf Viande de Boeuf Française oignons cuites - U - 300 g
-
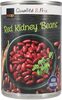
Red Kidney Beans - coop - 435g
-
Lentilles vertes - Lunor - 500 (500)

-
Betteraves rouges cuites à la vapeur - Maison Allaire - 500 g x 2
-
Galette ( aux Legumes du Soleil ) - Saint eloi - 1
-
Poireaux Émincés - Lunor - 400 g
-
Pommes de terre entière sans peau - Fraîchement Cuit - 370 (370)
-
Artichauts grilles - Bio Gustiamo

-
Betterave Cube - Allaire - 2 x 200 g
-
Betteraves rouges cuites et épluchées - Carrefour - 1 kg (2 x 500 g)
-
Haricots verts coupés Extra fins France Bio - La Fourche - 0,36 kg
-
haricots blancs à la tomate

-
Brocolis cuits - Marque Repère - 750 g

-
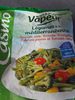
Légumes à la méditerranéenne Haricots verts, Brocolis, Courgettes, Poivrons jaunes et Tomates cerises - Cuisson vapeur - Casino - 3 x 200 g
-
Onion rings*sauce aïoli *rondelles d'oignons panées - Auchan - 0.25 kg

-
Lentilles vertes - Freshona
-
Attiéké - Bonjour Afrique - 100 g

-
Lentilles vertes aux tomates & coriandre - jardin BIO etic - 280g
-
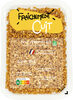
Carottes lamelles - Fraîchement Cuit - 280 (280)

-
Racines rouges - Coop - 500g

-
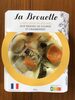
Curry doux de légumes aux graines de courges et cranberries - La Brouette - 280 g
-
Haricots verts extra fins cuits - Notre Jardin - 750 g
-
Pommes de terre entières cuites à la vapeur - Terr'loire - 500 g
-
Semoule de Manioc - Racines Bio

-
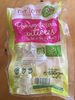
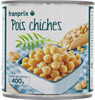
pois chiches cuits - Franprix
-
Betteraves rouges cuites - La Vie Claire - 500 g
-
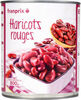
haricots rouges cuits - Franprix - 800 g net, 500 g égoutté
-
Petit Epeautre BIO - Lunor - 250 (250)
-
Petit Pois Doux Déjà Cuit Vapeur - Picard - 750 g

-
Betteraves Rouges Cuites et Épluchées - - 500 g
-
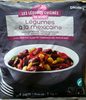
Légumes à la mexicaine - Picard - 1 kg
-
Chick Peas - Cedar Phoenicia - 19 fl oz