Stuffed pastas
Belongs to:
Contains:
- Agnolotti
- Cannelloni
- Cooked fresh pasta stuffed with cheese and vegetables
- Fresh pasta stuffed with cheese and vegetables
- Pasta stuffed with cheese
- Pasta stuffed with fish
- Pasta stuffed with meat
- Pasta stuffed with vegetables
- Pierogi
- Ravioles du Dauphiné
- Ravioli
- Ravioli with ricotta and spinach
- Tortellini
- Tortelloni
- fr:Ravioles
- it:Agnolotti pavesi
Nutrition facts
Average nutrition facts for the 5667 products of the Stuffed pastas category for which nutrition facts are known (out of 5916 products).
| Nutrition facts | As sold for 100 g / 100 ml |
Standard deviation | Minimum | 10th centile | Median | 90th centile | Maximum |
|---|---|---|---|---|---|---|---|
| Energy |
937 kj (224 kcal) |
259 kj (62 kcal) |
0 kj (0 kcal) |
417 kj (100 kcal) |
1,000 kj (240 kcal) |
1,260 kj (300 kcal) |
4,640 kj (1110 kcal) |
| Fat | 6.47 g | 2.72 g | 0 g | 2.4 g | 6.3 g | 11 g | 100 g |
| Saturated fat | 2.55 g | 1.48 g | 0 g | 0.6 g | 2.4 g | 5.4 g | 50 g |
| Monounsaturated fat | 1.22 g | 0.345 g | 0 g | 0.45 g | 1.25 g | 1.76 g | 2.7 g |
| Polyunsaturated fat | 0.328 g | 0.181 g | 0 g | 0 g | 0.39 g | 0.7 g | 2.9 g |
| Trans fat | 0 g | 0.003 g | 0 g | 0 g | 0 g | 0 g | 0.51 g |
| Cholesterol | 26.2 mg | 20 mg | 0 mg | 4 mg | 25 mg | 63 mg | 98 mg |
| Carbohydrates | 30.6 g | 10.2 g | 0 g | 12.7 g | 32 g | 46 g | 81.8 g |
| Sugars | 2.62 g | 1.35 g | 0 g | 0.9 g | 2.3 g | 5.2 g | 72 g |
| Added sugars | 0.586 g | 1.09 g | 0 g | 0 g | 0 g | 3.33 g | 5.05 g |
| Fiber | 2.17 g | 0.941 g | 0 g | 1 g | 2 g | 4 g | 48 g |
| Proteins | 8.87 g | 2.75 g | 0 g | 3.8 g | 9.2 g | 13 g | 70 g |
| Salt | 1.07 g | 0.309 g | 0 g | 0.6 g | 1 g | 1.6 g | 880 g |
| Alcohol | 0 % vol | 0 % vol | 0 % vol | 0 % vol | 0 % vol | 0 % vol | 0 % vol |
| Vitamin A | 94.6 µg | 127 µg | 0 µg | 15 µg | 48.8 µg | 372 µg | 3,180 µg |
| Vitamin D | 0.06 µg | 0.135 µg | 0 µg | 0 µg | 0 µg | 0.556 µg | 282 µg |
| Vitamin C (ascorbic acid) | 0.783 mg | 1.14 mg | 0 mg | 0 mg | 0 mg | 3.53 mg | 21.2 mg |
| Vitamin B1 (Thiamin) | 27.1 mg | 88.3 mg | 0 mg | 0.182 mg | 0.37 mg | 320 mg | 41,200 mg |
| Vitamin B2 (Riboflavin) | 0.233 mg | 0.08 mg | 0 mg | 0.2 mg | 0.26 mg | 0.28 mg | 290 mg |
| Vitamin B9 (Folic acid) | 233 µg | 44.6 µg | 70 µg | 212 µg | 246 µg | 256 µg | 256 µg |
| Potassium | 198 mg | 87.4 mg | 25 mg | 100 mg | 171 mg | 354 mg | 4,880 mg |
| Calcium | 70.9 mg | 50.1 mg | 0 mg | 8 mg | 70 mg | 157 mg | 504 mg |
| Iron | 1.27 mg | 0.525 mg | 0 mg | 0.64 mg | 1.12 mg | 2.22 mg | 400 mg |
| Fruits‚ vegetables‚ nuts and rapeseed‚ walnut and olive oils | 8.29 % | 10.1 % | 0 % | 0 % | 5 % | 31 % | 58 % |
| Fruits‚ vegetables and nuts - dried | 1.76 % | 3.1 % | 0 % | 0 % | 0 % | 8.9 % | 10.2 % |
| Fruits‚ vegetables‚ nuts and rapeseed‚ walnut and olive oils (manual estimate from ingredients list) | 19 % | 8.84 % | 2 % | 4.9 % | 19.7 % | 34.2 % | 50 % |
5,897 products
-
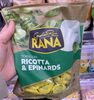
Tortellini ricotta & épinards - Rana - 250 g
-
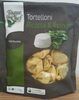
Premium Tortelloni Ricotta & Spinach - Lidl - 250 g ℮
-
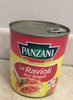
Le Ravioli, Pur Bœuf - Panzani - 800 g
-
Ravioli au tofu, tomates, basilic - Céréal Bio - 267 g
-
Ravioli pur bœuf sans colorant ni conservateur - Panzani - 400 g

-
Raviolis végétariens - Toque du Chef - 650 g
-
Tortellini prosciutto crudo - Baresa - 250 g
-
Tortellini Pesto, Basilic & pignons - Rana - 250 g
-
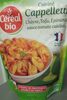
Cuisiné cappelletti - Céréal Bio - 220 g
-
Tortelloni Pesto basilic & Pignons - Toque du Chef - 250g
-
Cappelletti Jambon Cru - Rana - 250g

-
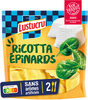
GIRASOLI RICOTTA EPINARD - Lustucru Lustucru selection - 250 g
-
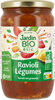
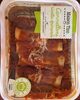
Pâtes farcies aux légumes à la sauce tomate bio - Jardin bio - 675 g
-
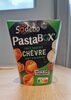
PastaBox - Tortellini Ricotta Epinards Sauce au parmesan - Sodebo - 280 g

-
PZ RAVIOLI BOLO 800GR - Panzani - 800 g
-
Cannelloni Ricotta et Epinards - WW - 290 g

-
Lustucru girasoli tomate basilic mozzarella 250g - 250 g
-
Tortellini Pesto Rosso, Tomates Séchées & Pignons - Giovanni Rana - 250 g
-
Lustucru tortellini jambon cru 250g - 250 g
-
Ravioli boeuf - Lustucru - 300 g
-
Porcini Mushroom and Ricotta Tortelloni - Italiamo - 250 g
-
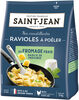
Ravioli aux girolles poêlées & persil de la Drôme sachet - Saint jean - 250 g
-
Lustucru selection ravioli 4 fromages 305g - 305 g
-
Gourmet - Pâtes fraîches aux œufs farcies aux champignons - Rana - 250g
-
Ravioli bio au blé complet épinards ricotta burrata - Giovanni Rana - 250 g
-
BARILLA Tortellini Emiliani Ham and Cheese - 250 g
-
Tortellini basilic parmesan 250g - Lustucru sélection - 250 g

-
Ravioles du Dauphiné LABEL ROUGE IGP Lot de - Saint jean - 2 x 240 g
-
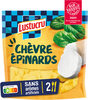
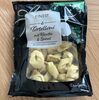
Tortellini Chèvre & Épinards - Carrefour - 300 g

-
Tortelloni ricotta epinards - Dorolina - 250 g
-
Tortellini Ricotta Epinards aux oeufs frais - Turini - 300 g

-
Rana Aubergine Parmigiana Fresh Tortelloni - 250g

-
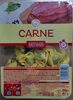
Tortelloni de carne - Hacendado - 250 g
-
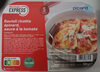
Ravioli ricotta épinard, sauce à la tomate - Picard - 300g e
-
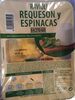
Ravioli requesón y espinacas - Hacendado - 250 g
-
Medaglioni with basil and pine nuts - Italiamo - 250 g

-
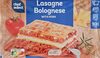
Лазаня Болонезе със свинско месо, сос Бешамел и Ементал - Chef Select - 1 kg
-
Girasoli potiron & petits oignons grillés - Rana Giovanni Rana - 250 g

-
Cannelloni ricotta epinards - Maison Tino - 750 g
-
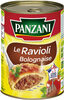
Le Ravioli Bolognaise sans conservateur - Panzani - 400 g
-
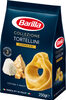
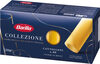
Tortellini Fromage - Barilla - 250 g
-
Lustucru ravioli chevre epinard 250g - Lustucru selection - 250 g
-
RAVIOLINI jambon cru - 250 g

-
Mezzelune Homard & Crevettes - Rana - 250 g

-
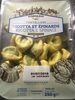
Tortellini Ricotta épinards - Rana - 250 g
-
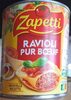
Ravioli pur bœuf - Zapetti - 400 g

-
Cannelloni - Barilla - 6pcs
-
Ravioles à poêler au fromage frais et Basilic de Provence sachet - Saint jean - 310 g
-
Tortellini Fromages italiens - Rana - 250 g
-
Tortellini Epinards Ricotta - Toque du Chef - 400g
-
Tortelloni with creamy ricotta & spinach - CHEF SELECT - 500 g
-
Ravioli vegetariens - Carrefour Bio - 650 g
-
Ravioli pur boeuf français - Zapetti - 800 g
-
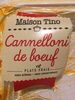
Cannelloni de boeuf - Maison Tino - 750 g
-
mushroom & mascarpone tortelloni - Rana - 250g
-
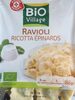
Ravioli Ricotta Epinards - Bio Village - 250 g
-
Tortelloni ricotta & épinards - Lidl Deluxe - 250 g ℮
-
Pâtes fraîches champignons et mascarpone - Casa morando - 250 g
-
Ravioli 6 légumes - Zapetti - 800 g
-
Capelletti - Italiamo - 250g

-
Tortellini ricotta & épinards - Giovanni Rana - 325 g

-
Ravioli Pur Bœuf - Toque du Chef - 800 g

-
Tortellini ricotta épinard - Carrefour - 300 g
-
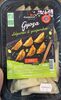
Gyoza poulet - Ajinomoto - 212 g (10 pièces)
-
Raviolis du Dauphiné - Nos Régions ont du Talent - 240 g

-
Rana spinach and ricotta fresh tortelloni - 250 g
-
Ravioli Légumes grillés et pignons de pin - Voltan - 250g

-
Pesto - Emma Giordani - 140 g

-
Ravioli tomates rôties et burrata - Voltan - 250 g
-
Spinach and Ricotta Tortelloni - Tesco - 300 g
-
Ravioli au boeuf - Panzani - 800 g

-
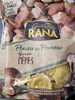
Girasoli cèpes parmesan - Lustucru - 250 g

-
Vegane Maultaschen mit feinem Gemüse - Bürger - 6pcs
-
Spinach Ricotta Tortelloni - Sainsbury's
-
Gyoza - Raviolis farcis aux légumes - AFE - 424g

-
Ravioles du Dauphiné LABEL ROUGE IGP 240g - Saint jean - 240 g
-
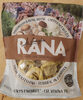
Plaisir du primeur - Rana - 250 g
-
Ravioli Pur Bœuf - Carrefour - 400 g

-
Ravioli Bœuf et Oignons - Turini - 300 g
-
Gnocchi quesos - Hacendado - 400 g
-
Tortellini - Pesto Rosso, tomates séchées et pignons - Rana - 325g
-
Ravioli aux fromages - D'ANTELLI - 300 g
-
Tortellini chèvre sauce tomate - Sodebo - 280g
-
Girasoli cèpes - Rana - 250 g
-
Tortelloni mit Ricotta & Spinat - Tastino
-
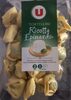
Tortellini ricotta epinard - U - 300 g
-
Chicken Gyoza Dinner Dumplings - Itsu - 240 g
-
Tortellini Prosciutto Crudo - Rana - 250g
-
Ravioli in Tomatensauce mit fleischhaltiger Füllung - Maggi - 800 g

-
TORTELLINI BACON RICOTTA & MOZZARELLA - Rana - 250 g

-
RAVIOLI JAMBON CRU, FIGUES & RICOTTA - Rana - 250 g

-
Vegan tortelloni with meat alternative filling - Vemondo - 250 g
-
GRANDI GIRASOLI GORGONZOLA ET NOIX RANA - 250 g
-
Tortellini Ricotta & Epinards - Rana - 2 x 250 g

-
Ravioli bolognaise - Fleury Michon - 300 g
-
Cannelloni ricotta, épinards - Picard - 850 g (3 à 4 parts)

-
Grandi Girasoli - Ricotta, Epinards & Mascarpone - Giovanni Rana - 250 g

-
Ravioli 4 fromages - Carrefour - 300 g

-
Pasta Snack Käse-Sahne-Soße - Knorr - 71 g
-
Gyoza - Coquelicot - 200g