Vegetable soups
Belongs to:
Soups, Meals, Fruits and vegetables based foods, Plant-based foods, Plant-based foods and beverages
Contains:
- Asparagus soups
- Bean soups
- Canned vegetable soups
- Carrot soups
- Cream of vegetable soups
- Dehydrated asparagus soup
- Dehydrated green vegetables soups
- Dehydrated leek and potato soup
- Dehydrated mixed vegetables soup
- Dehydrated onion soup
- Dehydrated tomato soup
- Dehydrated vegetable soups
- Frozen vegetable soups
- Gazpacho
- Heatable onion soup
- Onion soups
- Pumpkin soups
- Refrigerated vegetable soups
- Reheatable green vegetables soups
- Reheatable mixed vegetables soup
- Reheatable tomato soup
- Reheatable tomatoes and vermicelli soup
- Reheatable vegetable soups
- Reheatable vegetables soups with cheese
- Tomato soups
- Zucchini soups
- fr:Soupes à l'ortie
Nutrition facts
Average nutrition facts for the 4050 products of the Vegetable soups category for which nutrition facts are known (out of 4305 products).
| Nutrition facts | As sold for 100 g / 100 ml |
Standard deviation | Minimum | 10th centile | Median | 90th centile | Maximum |
|---|---|---|---|---|---|---|---|
| Energy |
197 kj (48 kcal) |
97 kj (24 kcal) |
0 kj (0 kcal) |
111 kj (26 kcal) |
172 kj (41 kcal) |
356 kj (87 kcal) |
5,020 kj (1200 kcal) |
| Fat | 1.88 g | 1.13 g | 0 g | 0.5 g | 1.6 g | 4.1 g | 43.5 g |
| Saturated fat | 0.547 g | 0.439 g | 0 g | 0.1 g | 0.4 g | 1.5 g | 60 g |
| Monounsaturated fat | 0.706 g | 0.753 g | 0 g | 0 g | 0.42 g | 2.31 g | 9 g |
| Polyunsaturated fat | 0.373 g | 0.325 g | 0 g | 0 g | 0.42 g | 0.83 g | 22 g |
| Trans fat | 0.002 g | 0.012 g | 0 g | 0 g | 0 g | 0 g | 1.04 g |
| Cholesterol | 1.1 mg | 2.09 mg | 0 mg | 0 mg | 0 mg | 6 mg | 60 mg |
| Carbohydrates | 5.21 g | 2.37 g | 0 g | 2.6 g | 4.7 g | 9.6 g | 247 g |
| Sugars | 2.12 g | 1.09 g | 0 g | 0.7 g | 1.9 g | 4.17 g | 46 g |
| Added sugars | 0.41 g | 0.571 g | 0 g | 0 g | 0 g | 1.52 g | 7.19 g |
| Polyols (sugar alcohols) | 0 g | 0 g | 0 g | 0 g | 0 g | 0 g | 0 g |
| Fiber | 1.24 g | 0.669 g | 0 g | 0.5 g | 1.1 g | 2.5 g | 28 g |
| Proteins | 1.17 g | 0.792 g | 0 g | 0.56 g | 0.9 g | 2.9 g | 62 g |
| Salt | 0.68 g | 0.196 g | 0 g | 0.4 g | 0.67 g | 1 g | 2,020 g |
| Alcohol | 0 % vol | 0 % vol | 0 % vol | 0 % vol | 0 % vol | 0 % vol | 0 % vol |
| Vitamin A | 140 µg | 96.6 µg | 0 µg | 0 µg | 140 µg | 317 µg | 1,500 µg |
| Vitamin D | 0.175 µg | 0.397 µg | 0 µg | 0 µg | 0 µg | 1.3 µg | 2.5 µg |
| Vitamin C (ascorbic acid) | 7.45 mg | 7.48 mg | 0 mg | 0 mg | 5 mg | 22.5 mg | 280 mg |
| Potassium | 192 mg | 110 mg | 0 mg | 47 mg | 180 mg | 458 mg | 825 mg |
| Calcium | 22.9 mg | 17.3 mg | 0 mg | 8 mg | 17 mg | 62 mg | 783 mg |
| Iron | 0.603 mg | 0.37 mg | 0 mg | 0.15 mg | 0.48 mg | 1.38 mg | 6.92 mg |
| Fruits‚ vegetables‚ nuts and rapeseed‚ walnut and olive oils | 45.1 % | 19.7 % | 0 % | 15.2 % | 42 % | 81.6 % | 100 % |
| Fruits‚ vegetables‚ nuts and rapeseed‚ walnut and olive oils (manual estimate from ingredients list) | 48.5 % | 17.5 % | 14.4 % | 30 % | 44 % | 87 % | 96.9 % |
4,297 products
-
Alvalle Gazpacho l'original - 1L

-
Gazpacho Tradicional - Hacendado

-
Gazpacho original - Alvalle - 1 l
-
Gazpacho tradicional - Chef select - 1 L

-
Cream of Tomato Soup - Heinz - 400g
-
Alvalle Gazpacho tomate, menthe & basilic 1 L - 1000 ml
-
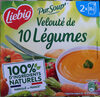
PurSoup' Velouté de 10 légumes - liebig - 1 l

-
Gazpacho salmorejo - Alvalle - 1000 ml

-
Gazpacho fresco - Hacendado

-
Gazpacho l'original - Alvalle - 500 ml

-
Gazpacho concombre & menthe - Alvalle - 1000 ml

-
Knorr Soupe Minestrone à l'Huile d'Olive 104g 4 Portions - 104 g
-
Gazpacho green - Alvalle - 1000 ml

-
Gazpacho tomate, pastèque & menthe - Alvalle - 1000 ml

-
Soupe Thai (Nouilles, champignons et pousses de soja) د تای سوپ - Knorr - 69 g

-
Gazpacho Tradicional - Hacendado - 330 ml

-
Velouté de légumes - Liebig - 75 cl
-
Mouliné de 10 légumes - Liebig - 1 l

-
Alvalle Gazpacho l'original format spécial 1,10 L - 1 litre

-
bio mouliné de légumes verts🥒🥦 - Liebig - 1 l.
-
KNORR Soupe Déshydratée Passée aux 9 Légumes 105g - 105 g
-
Soupe à l'indienne - Royco - 76,5 g
-
Les classiques - Velouté de 9 légumes - Knorr - 1000 ml

-
Knorr Soupe Liquide Mouliné de Légumes Variés 1L - 1000 ml
-
Knorr Soupe DCR 9 Legumes 84g - 84 g ℮
-
Velouté de Potiron - Liebig - 750ml

-
Knorr douceur 8 legumes 1l 8x - 1000 ml
-
Gazpacho fresco - García Millán - 1L
-
L'essentiel - gazpacho légumes du soleil - Saint eloi - 1 L
-
Gazpacho fresco - Hacendado - 330 ml
-
Le Gazpacho original - Créaline - 750 ml

-
Knr leg potager 45cl - Knorr - 450 ml

-
PurSoup' Velouté de 10 Légumes - Liebig - 30 cl
-
Mouliné légumes du potager - Liebig
-
Crema de calabaza y zanahoria - Hacendado - 350 g
-
Gazpacho - U - 1 l

-
Royco velouté 12 légumes
-
Knr potiron pte musc 45cl - Knorr - 450 ml

-
Velouté 6 légumes bio - Liebig - 75 cl

-
Velouté 10 légumes - Toque du Chef - 1 L

-
salmorejo - Hacendado - 330 ml
-
Velouté de potiron - Liebig - 30 cl
-
Pur Soup' - Velouté de légumes du soleil - Liebig - 1 L
-
Velouté de Poireaux et Pommes de Terre - Liebig - 2x30cl
-
Vegetable soup - Heinz - 400 g
-
Velouté tomates - ROYCO - 72g
-
Potiron et Kiri - Liebig - 2x30cl
-
Gaspacho original - Soupe de tomate et légumes, basilic et menthe - La Potagère - 1 l g

-
Salmorejo - Hacendado - 1 l

-
Alvalle Gazpacho bio 75 cl - 750 ml
-
Mouliné de Légumes BIO - Liebig - 1 l
-
Légumes et croûtons - royco - 3 sachets 20cl

-
Lentil Soup - Heinz - 400 g
-
Knorr Poulet Vermicelle 1L 8x - 1000 ml

-
Tomato & Basil - New Covent Garden Soup Co. - 560 g
-
Vegetable soup - New Covent Garden - 2 x 280 g
-
Velouté de potiron & carottes BIO - Liebig - 75 cl

-
Mouliné de 10 légumes - Liebig - 2x30 cl
-
Mouliné 12 légumes -25% de Sel - Liebig
-
Velouté de 12 legumes - Liebig - 1 L

-
Velouté lentilles corail - Picard - 1 kg
-
Covent garden soup - 2 x 280 g

-
Knr tomate pte basil 45cl - Knorr - 450 ml

-
Mouliné de légumes - Liebig - 60 cl (2x30cl)

-
Mouliné 12 légumes - Royco - 64,4 g (4 x 16,1 g)
-
Mushroom Soup - New Covent Garden Soup Co - 2 x 280 g
-
Douceurs d'asperges - Knorr® - 96 g e

-
Velouté poireaux pommes de terre - Royco - 54g (4x13,5g)
-
Soupe à l'Oignon - Knorr - 84 g
-
Crema espárragos - Hacendado - 350 g

-
Bio Velouté de Légumes du soleil - Liebig - 1L
-
Velouté de Légumes saveur du Sud - Carrefour Bio - 1 l
-
Knr leg lent corail 750ml - Knorr - 750 ml
-
Knorr vel legum fra 1l - 1000 ml

-
Knorr veloute potiron 1l - 1000 ml
-
SOON Veggie Ramyun Noodle Soup - Nongshim - 112 g
-
Knorr soupe chorba 100g - 100 g
-
Gazpacho -

-
Minestrone Façon Napolitaine - Liebig - 1 L
-
Knorr patate Douce 450ml - 450 ml
-
Knorr WSO Poireaux Vel 1L - 1000 ml

-
Mouliné de legumes verts - Liebig

-
Knr tomate mozza 96g br - Knorr - 96 g

-
bio velouté de potiron & graines de courge - Liebig - 1 L
-
Velouté 7 Légumes Bio - Carrefour - 1 l

-
Légumes et vermicelles - Liebig - 2 x 30 cl
-
Pois cassés - Saint eloi - 500 g
-
Potage Minestrone - Picard - 1 kg
-
Knorr Soupe Crème de Potiron 100g 3 Portions - 100 g

-
Knorr mouline tomate 1l - 1000 ml

-
Gazpacho - Dia - 1 l

-
velouté de tomates - Liebig - 75 cl e
-
Plant based tomato soup - Heinz - 400g
-
Soupe à la chinoise - Liebig - 1 L
-
Soupe trio de légumes vertd - Liebig - 75 cl
-
Gazpacho - HACIENDA DEL SABOR - 1 L
-
Knorr Moments Gourmets Soupe déshydratée Velours de Cèpes Champignons 91g 3 Portions - 91 g

-
Pasta Soup' - Tomates et Vermicelles - Liebig - 1 L

-
Spiced Butternut soup - New Covent Garden Soup Co - 560g
-
Délice de potiron châtaigne - Liebig - 2 x 30 cl